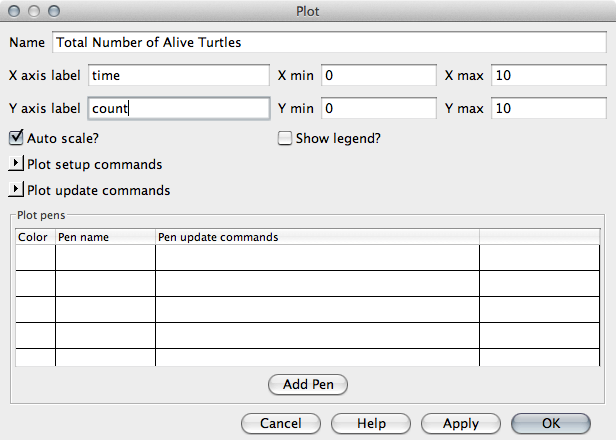
| Name: | Total Number of Alive Turtles |
| X axis label | time |
| Y axis label | count |
| Auto scale: | ✓ (This makes the axes grow over time) |
|
Next, we need to tell NetLogo how to draw the graph. To do this, it uses something called 'Plot Pens'. It is possible to have multiple pens per graph to draw a number of different things simultaneously. For this practical, we will create a single 'pen' that draws the number of turtles who are alive at a given time.
turtles-alive and choose a colour for the pen
(this will determine the colour of the line on the chart). In the right figure I chose
orange, but the colour doesn't matter.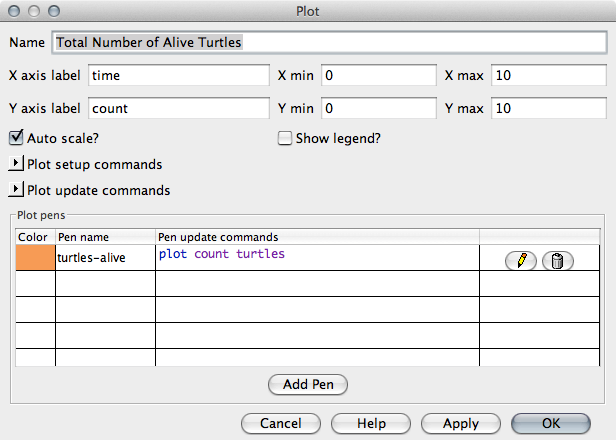
plot count turtles
This will plot the number of turtles currently in the model.Try running the model, sadly nothing will be drawn on the graph. To make the graph work there are two very small changes that we need to make to the model.
setup procedure, add the following code just before creating
the patches and the turtles:
__clear-all-and-reset-ticks
What this strange command does is remove everything from the model and reset the 'tick
counter' to zero. This will be run each time you click on the 'setup' button. If we
don't do this, then the graph never goes back to zero, even after the model has been
reset. Your
setup procedure should now look something like this:
                to setup

                 print "Setting up model."

                 __clear-all-and-reset-ticks

                 setup-patches

                 setup-turtles

                end
go procedure. At the very end, just before the
end command (that tells NetLogo we have finished with the go
procedure add the single command:
tick
This makes NetLogo increment it's internal clock so we know how many iterations have
passed since the model began running. The plot needs to know this.