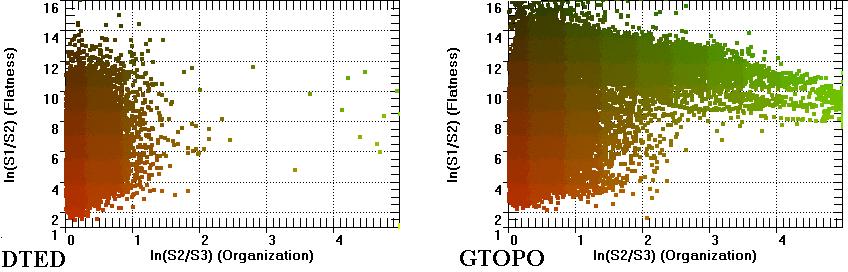
Flatness vs. Organization Graphs
All graphs are color coded, with the red intensity proportional to steepness or the inverse of the ln(S1/S2) ratio (flatness) and green intensity proportional to the ln(S2/S3) ratio (organization).
Images on this page
Graph with flatness vs organization for 1° cells, with DTED Level 0 on the left and GTOPO30 on the right. GTOPO30 has about twice as many populated cells, and a large number of them are in Antarctica and Greenland. Global classification maps from GTOPO30 show that the ice sheets have different characteristics from other regions of earth. Many of these are highly organized, but properties of the DEMs (converging meridians) and the ice surface (relatively flat and smooth) mean that they are not typical of landforms elsewhere. While DTED was the source for much of GTOPO30, the two data sets have different characteristics. Based on a subjective assessment, I prefer DTED Level 0 data to GTOPO30. Each 1° cell contains about 14,000 points
Animation showing the effect of changing the sample region size with DTED Level 0. As the sample region decreases in size, there are increasing numbers of highly organized blocks. The largest sample size (indicated with a 1 in the lower left comer) uses 1° cells; the others use 1/2° cells (shown with a 2) and 1/3° cells (shown with a 3) . Each 1° cell contains about 14,000 points, so even the 1/3° cells contain over 1600 points.
Animation showing 30 m USGS 1:24,000 DEMs:
Comparing the 30 m data with the 30" data in the two panels above, note that the 30" data has many more points with much greater flatness--the global DEMs smooth out the topography and have much lower average slopes.