The Command Centre and Basic Commands
Before starting, recall from the lecture that a model in NetLogo consists of 'patches', 'turtles' and the 'observer' (look at the lecture slide to refresh yourself if you have forgotten).
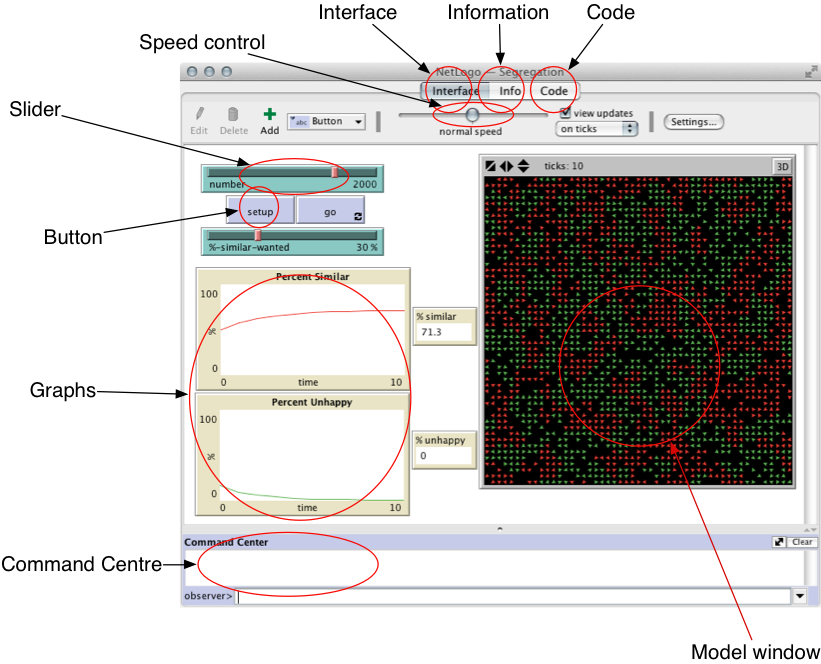
The command centre can be used to send commands to the model. There are two parts: the top part shows outputs from the model and the bottom part allows you to enter commands that are sent to the model. NetLogo has a fantastic user manual, so if it isn't clear what a command does, or how it should be used, look it up. The NetLogo Dictionary is particularly useful. Each time a new command is introduced, I have included a link to the official documentation.
The show
command
show. Type the following
into the command centre:show "Hello World"
You should see NetLogo repeat "Hello World" back to you, like this:
observer> show "hello world"
observer: "hello world"
Try this again with some other text (don't forget to put quotes around the text).This might not seem particularly useful, but the show command comes into
its own when you combine it with other commands.
The
count command
show and count as follows:
show count turtles
What does this show you? Try this as well:
show count patches What does that tell you?Two things are actually happening when you run those commands. The
count command is counting something (in this case the number of turtles
or patches). The show command is behaving the same way as it was before,
except now it is showing us the number provided by the count command,
rather than the "Hello World" text.
The
with command
with command to influence a group of all the turtles
or patches. Try the following:
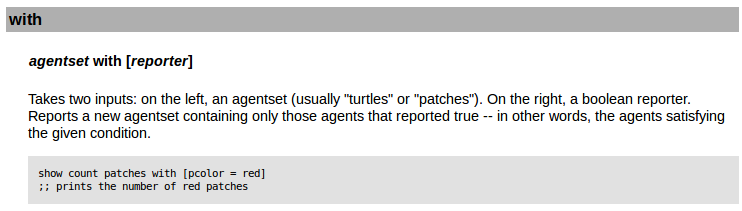
show count patches with [pcolor = green]
show count patches with [pcolor = brown]
What is happening with those two commands?
The with command actually needs two pieces of information. It needs
a group of agents or patches on the left, and a test on the right (in this case
we test the colour of the patches). You can find more information about all the
commands available in the
NetLogo documentation (click on 'NetLogo Dictionary' and then look
for the 'with' command.)
Variables
In NetLogo, it is possible to save values in things called 'variables' (for info, see
the documentation on variables).
Different parts of the model can check the values of the variables to decide what they should do.
For example, in the Wolf Sheep Predation model, each of the sliders changes the value of a variable.
So, if you move the wolf-gain-from-food slider from 20 to 40, that will change
the value of a variable called wolf-gain-from-food. Each time a wolf eats a sheep
it checks the value of that variable to decide how much new 'energy' it will gain. In this case,
it will now get 40 units rather than only 20.
Individual turtles and patches can also have their own variables; this is one of the ways
that models can account for heterogeneity (we'll cover this in more detail in later lectures).
For example, in the Wolf Sheep Predation model, the wolves and sheep
have a variable called energy. This records how much energy each individual
wolf or sheep will have at any given time. If this reaches zero, then they will die.
We'll look at variables in more detail in the next section.
The
set command
The last command we'll look at is set. This command can be used to
manually change the values of variables without having to use a slider. You tell the
command which variable to change, and what to change it to.
set commands. Before running
each command, setup the model. Then execute the command and then let the model run for
10-20 seconds.
            set sheep-gain-from-food 12

            set sheep-gain-from-food 50

            set initial-number-wolves 100

            set wolf-reproduce 10