Table of Contents
| 1. Running an example model |
| 2. The Basics |
3. Using ask |
To start off, we'll just look at two models so that you can get an idea about how NetLogo works.
The first thing to do is start NetLogo. You can find the it by going to Start - All Programs - Departmental Software - Environment - Geography - NetLogo 5.0.2 > NetLogo 5.0.2 (or type 'NetLogo' into the search box).
NetLogo ships with a variety of ready-made models in the 'Models Library'. To see a list of the models that are available go to File -> Models Library.
To begin, we will use a version of Schelling's famous model of residential segregation. The model is listed under Social Science -> Segregation. Start that model now. At each iteration of the model, each agent looks at its 8 neighbours and works out how many are the same colour as itself. If fewer than a certain percentage.
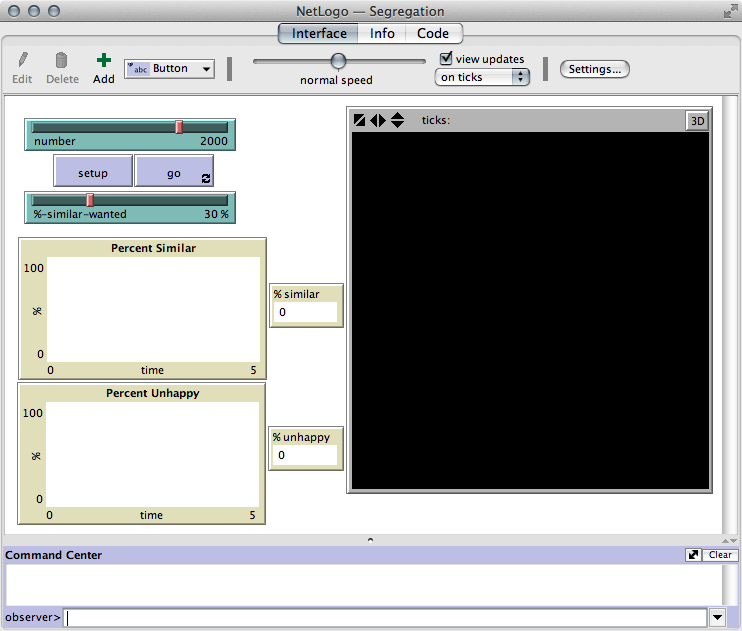
The model has the following graphical elements:
For more information about the model, or the function of the sliders and graphs, you can click on the 'Info' tab.
Spend a few minutes experimenting with the model and think about the following questions:
Finally, have a look at the code that underpins the model (click on the 'Code' tab). NetLogo code has been designed to be easy to use; you can accomplish a lot without having to become a fully-fledged computer programmer. The whole Schelling model has been written using only 79 lines.
Now have a look at another model called 'Virus' which is under 'Biology'. This model simulates the spread of a virus through a population as people come into contact with each other. Start by clicking on the Info tab and reading about how the model works.
Over the next few practicals we are going to build a model that looks similar to this one so play around with some of the settings to see how the model behaves.
When you have finished experimenting with different parameter values, move onto the next part of this practical to learn more about the basics of the NetLogo program.