Aughwick, Pennsylvania, Fabric Sensitivity to DEM

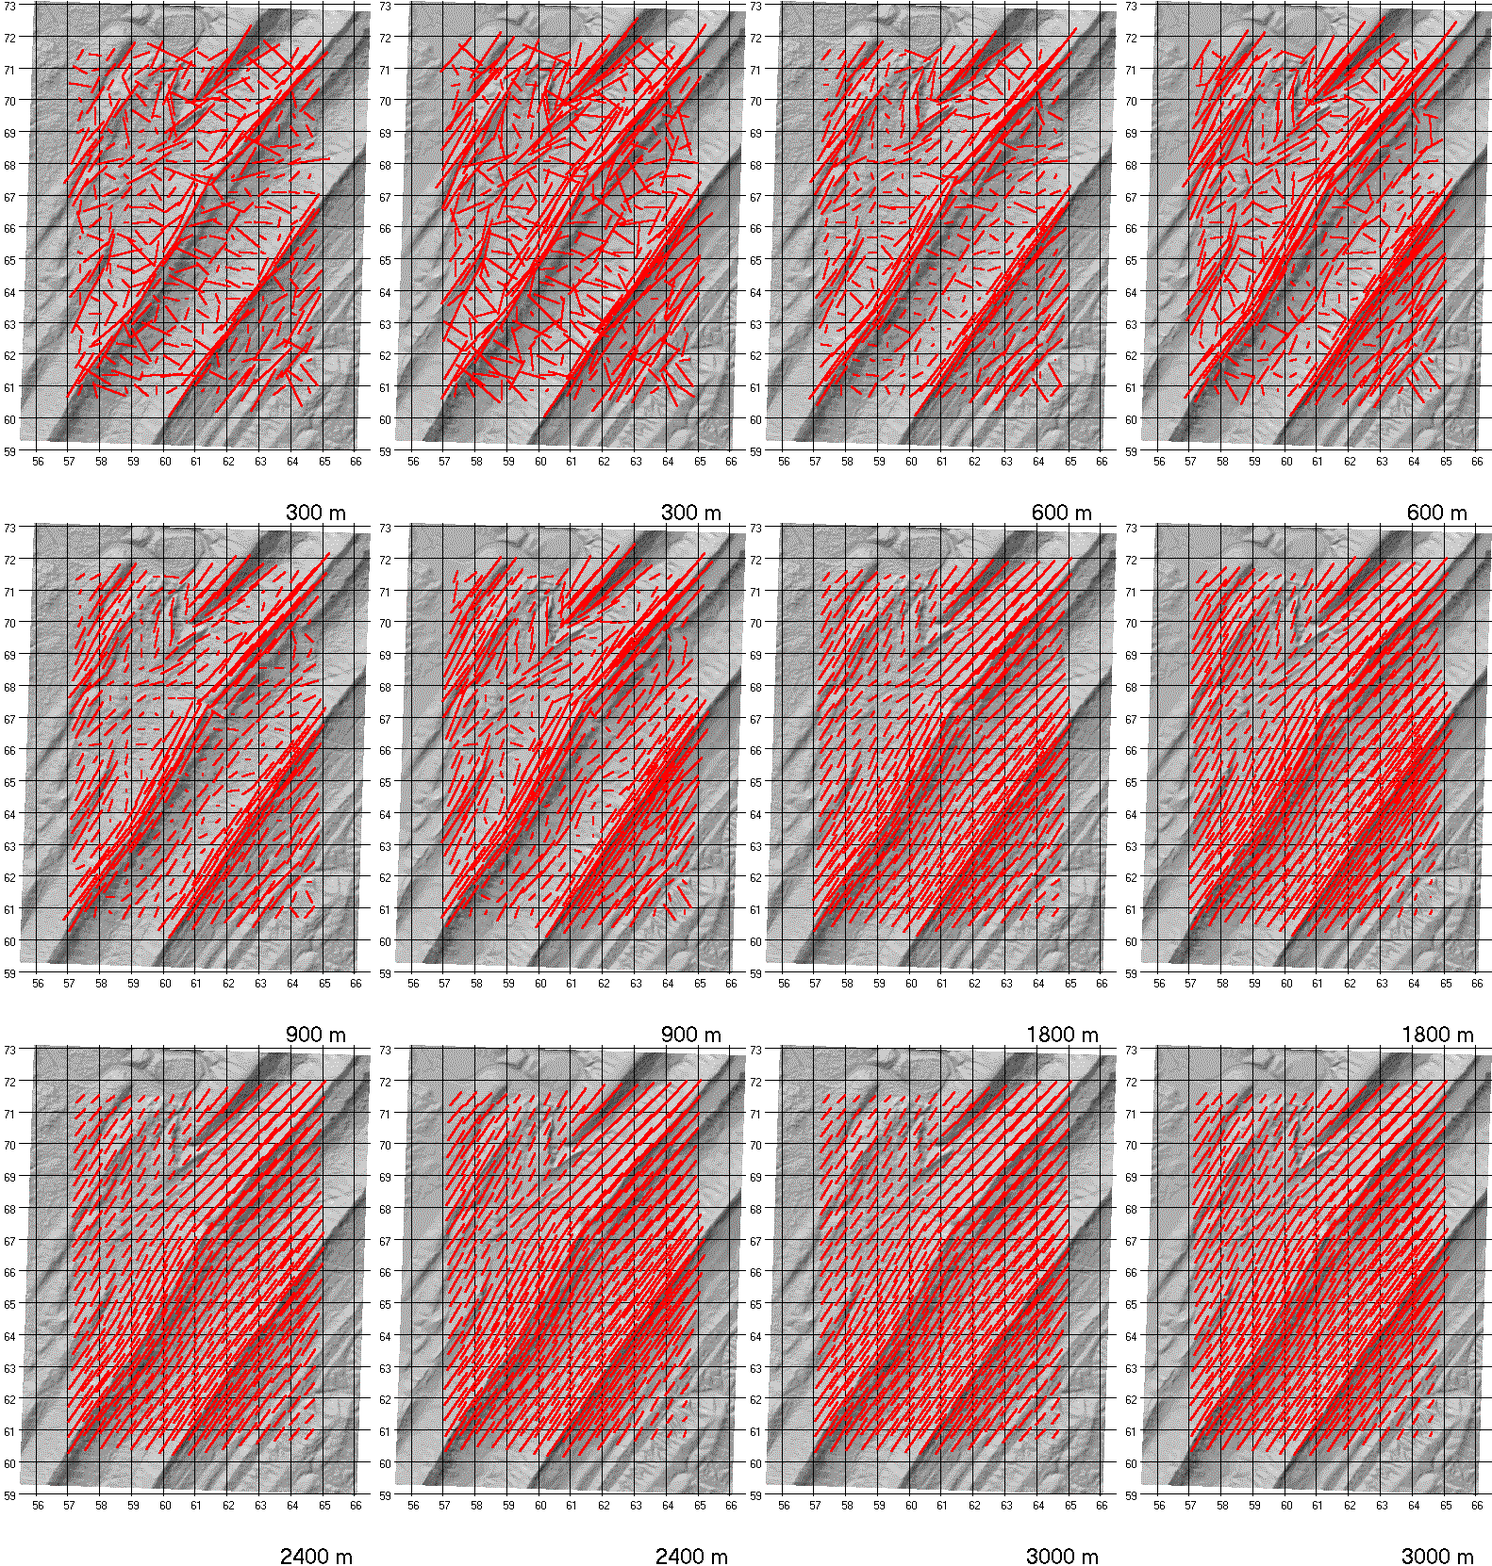
Animations of the topographic fabric computed with variously sized windows for two independent 1:24,000 DEMs of the Augwick, Pennsylvania, quadrangle. A 30 m level 1 DEM is on the left, and a 30 m level 2 DEM on the right.
Fabric intensity and orientation are computed and displayed every 500 m. To avoid edge effects, only the central portion of the DEM was used and all region sizes have the same number of computed points.
The three images are synchronized, so that the same frame shows the same region size in all three DEMs.
Ridge crests have different characteristics than the slopes or the valley bottoms. The crests show a consistent, strong fabric, whereas the slopes show a shift in the pattern. For small regions on the slopes, the dominant direction runs down the slope, measuring the small drainages and the ridges between them, oriented perpendicular to the dominant regional trend. Beyond a region size of about 1000 m, all points share a common orientation for the fabric.