Comparison of Level 1 and Level 2 DEMs
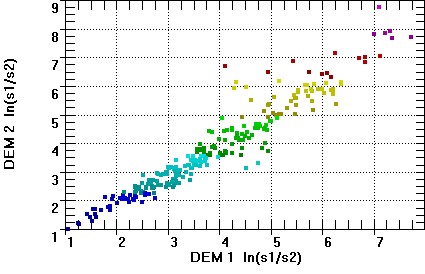
This is based on a sample of 250 USGS DEMs with independent Level 1 and Level 2 DEMs. All graphs are color coded with flatness. The mountainous DEMs will be in blue, and the flat DEMs in red and purple.
Flatness. The correlation coefficient is 0.956.
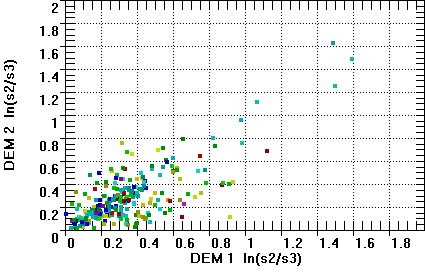
Organization.The correlation coefficient is 0.748.
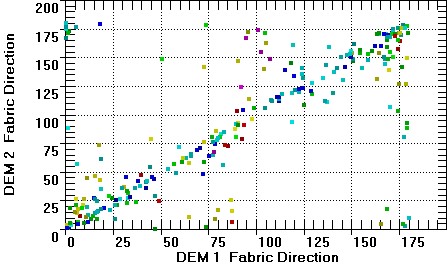
Fabric Direction.
Too many Level 1 DEMs have fabrics nears 0° , 90° , and 180° . Many of these DEMs were created with manual profiling, and maintain a spurious streaking in these directions. The eigenvalue analysis can recover this fabric, an artifact of the digitization process.