Aughwick Pennsylvania SSO Diagrams
Graphs of flatness, organization, and fabric direction
Animated SSO diagram for a ridge crest point in the Aughwick, PA, quadrangle. The animation shows the effect of increasing the region size from 300 m to 4200 m. With small regions, two clusters appear, one for the NW facing slopes and the other for the SE facing slopes. There are also no points in the center of the diagram, because there are no flat surfaces on the top of the ridge. As the region size increases, flat surfaces appear on the diagram because the region extends to the valley bottoms. The normals to the earth's surface form a girdle on the diagram with a NW-SE trend, because the ridges and valley trend NE-SE
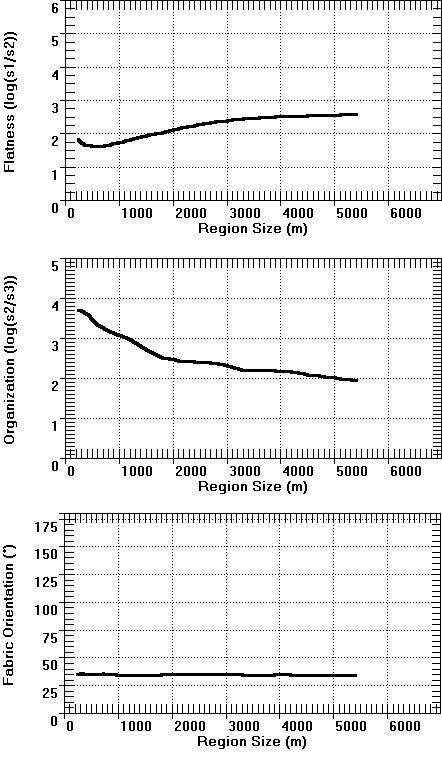
Graphs showing the effects of increasing the region size on the flatness and organization parameters, and the fabric orientation direction. For this DEM flatness increases as more the valleys are added to the ridge top. Organization decreases, because the valleys are less organized than the ridges. The fabric direction remains constant.
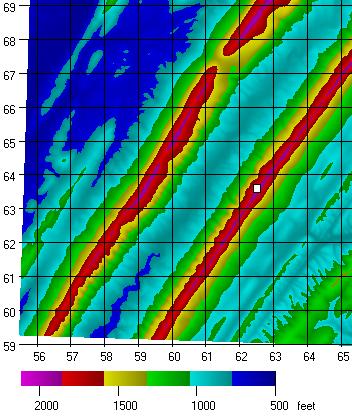
Location map, color coded by elevation, for the point used for the SSO and graphs. The map has a 1 km UTM grid.