GEOG5870/1M: Web-based GIS A course on web-based mapping
Additional overlay types
So far we have looked at three types of overlay: markers, lines and polygons. There are several other sorts of overlay supported by Google Maps, which we will consider briefly on this page.
Circles
A specialised form of polygon overlay is a circle. Circles can be added to a
map given a centre and a radius (and line and fill colours); they are made
available through the type google.maps.Circle().
The listings below show an HTML document, a map setup file, and part of an associated
data file. These draw a map with a set of markers representing (a subset of) secondary
schools in the London Borough of Waltham Forest. Like most local authorities,
distance from a school is one of the criteria used when selecting pupils for
over-subscribed schools; each year data are published showing a 'cut-off'
distance: the distance beyond which no pupils were accepted in the previous
year's entry. A circle is thus a good way of illustrating the areas from which
schools draw pupils (although of course, pupils aren't uniformly distributed in
this area, and pupils may be accepted from outside this area on other selection
criteria). The example also illustrates the dynamic modification of a web page
using JavaScript, given some input data.
The first file shown is the containing HTML document. This is similar to
those used before; the only element that might be worthy of initial note is the
empty <OL> list element at the bottom of the page.
Code for lbwf_schools.html
<!DOCTYPE html>

<html>

<meta http-equiv="content-type" content="text/html; charset=utf-8" />

<script type="text/javascript"

   src="http://maps.google.com/maps/api/js">

</script>

<script src="lbwf_schools_data.js" type="text/javascript"></script>

<script src="lbwf_schools_setup.js" type="text/javascript"></script>

<title>School catchment areas</title>

</head>

<body onload="init()">

<h1>School catchment areas</h1>

<p>This map shows catchment areas for a selection

of secondary schools in Waltham Forest, using cut off

distances as applied for intake in September 2010.</p>

<div class="gmap" id="map_canvas"

   style="width: 600px; height: 400px;"></div>

<h2>Notes</h2>

<ul>

<li>The colours of the map pins and the

associated circles are randomly assigned.

If any particular pin is too dark, then the page

can be re-loaded in order to assign new colours

<li>Not all schools are currently included on the map

<li>Some schools (those which are not

over-subscribed) do not have a distance cut-off

<li>The distance data is taken from

<a href="http://www.babcockwf.co.uk/

idocument/stream_document.aspx?ObjectId=338373">

Moving on - a guide to applying for a secondary

school place for September 2011</a>

published by the London Borough of Waltham Forest

</ul>

<h2>Schools</h2>

<ol start="0" id=school_list>

</ol>


</body>

</html>
The
second file illustrated shows the structure of the data file; the first two
entries are shown. Only the name of the school and a URL if available are
included along with the location and cut-off distance, although clearly one
could include a variety of other performance data. The locations have already
been converted to LatLng references.
Extract from code for lbwf_schools_data.js
var markers = [{

'latitude': 51.5567731,

'longitude':  0.0162396,

'url': 'http://www.buxtonschool.org.uk/',

'title': 'Buxton School',

'radius': 0

    },

    {

'latitude': 51.629601,

'longitude': -0.007813,

'url': 'http://www.chingford-school.co.uk/',

'title': 'Chingford Foundation School',

'radius': 4087

    },

 ...
The third file illustrated is the map setup file. A lot of this repeats aspects that we have already seen in earlier examples, on which we do not need to dwell. In this example, the markers are constructed as part of the main loop, rather than through a specific 'addMarker' function.
Code for lbwf_schools_setup.js
/*

 * The starting position and initial zoom factor

 *

 * These could be determined using the supplied data...

*/

var centreLat = 51.6;

var centreLong = -0.02;

var initialZoom = 11;

var map;


/*

 * generate random colours

*/


function genHex(){

   colors = new Array(15);

   colors[0]="0";

   colors[1]="1";

   colors[2]="2";

   colors[3]="3";

   colors[4]="4";

   colors[5]="5";

   colors[6]="6";

   colors[7]="7";

   colors[8]="8";

   colors[9]="9";

   colors[10]="a";

   colors[11]="b";

   colors[12]="c";

   colors[13]="d";

   colors[14]="e";

   colors[15]="f";


   digit = new Array(5);

   color="";

   for (i=0;i<6;i++){

      digit[i]=colors[Math.round(Math.random()*15)];

      color = color+digit[i];

   }


   return color;

}


function init() {


   function infoCallback(infowindow, marker) {

      return function() {

         infowindow.open(map, marker);

      };

   }


   var latlng = new google.maps.LatLng(centreLat, centreLong);

   var myOptions = {

      zoom: initialZoom,

      center: latlng,

      mapTypeId: google.maps.MapTypeId.ROADMAP

   };

   var map = new google.maps.Map(

      document.getElementById("map_canvas"),myOptions);


   var schools = '';


   for(id in markers) {


      var contentString = '<div class="iw">'+

         '<h1 class="iw_h1">'+ markers[id].title+'</h1>' +

         '<ul>' + '<li>www: '+'<a href="' + markers[id].url +

         '">'+ markers[id].title +'</a>' + '</ul>' + '</div>';


      var infowindow =

         new google.maps.InfoWindow({content: contentString});


      myColour=genHex();


      myLatlng = new

         google.maps.LatLng(markers[id].latitude,markers[id].longitude);

      var marker = new google.maps.Marker({

         position: myLatlng,

         map: map,

         icon:
'http://chart.apis.google.com/chart?chst=d_map_pin_letter&chld='+id+'|'+myColour+'|000000',

         title: markers[id].title

      });


      schools = schools + '<li>' + markers[id].title;


      google.maps.event.addListener(

         marker, 'click', infoCallback(infowindow, marker));


      // Add a Circle overlay to the map.

      var circle = new google.maps.Circle({

         map: map,

         fillColor: '#'+myColour,

         fillOpacity: 0.2,

         strokeWeight: 1,

         radius: markers[id].radius

      });


      circle.bindTo('center', marker, 'position');

   }


   document.getElementById('school_list').innerHTML = schools;


}
The loop has the following significant characteristics:
- Prior to starting the loop, we declare an empty string variable:
var schools='';. We will use this in due course... - For each entry that is read from the data file, we first create a marker, as normal.
- We also generate some info text from the supplied school information, and create an infowindow object.
- We append a string to the
schoolsstring: 'schools = schools + '<li>' + markers[id].title;'. This adds '<li>', which denotes an HTML list item, and the name of the school. - We create the circle object.
- We bind the circle to a marker.
The circle object declaration is similar to those that we have used for polygons.
      var circle = new google.maps.Circle({

         map: map,

         fillColor: '#'+myColour,

         fillOpacity: 0.2,

         strokeWeight: 1,

         radius: markers[id].radius

      });
The options can include an explicit centre (as a LatLng object), but
in this example we have only declared a radius (and colour information). Hence,
we need the second stage – that of binding the circle to the marker, using the
bindTo() method (an underlying method for objects in the maps
API). The binding process is more complex than we necessarily need (we could
just identify a centre position), but allows the circle visibility to be based
on that of the marker. Note that we do not explicitly add the circle to the map
in this example, as the marker to which it is bound has already been added.
Finally, in this example, we use a general JavaScript method to set the innerHTML property of the empty list that was added to our HTML page.
document.getElementById('school_list').innerHTML = schools;
Thus, without knowing in the HTML document how many schools we would use, or what they are called, we are able to update the text on the screen with a list of names.
Here's what it should look like:
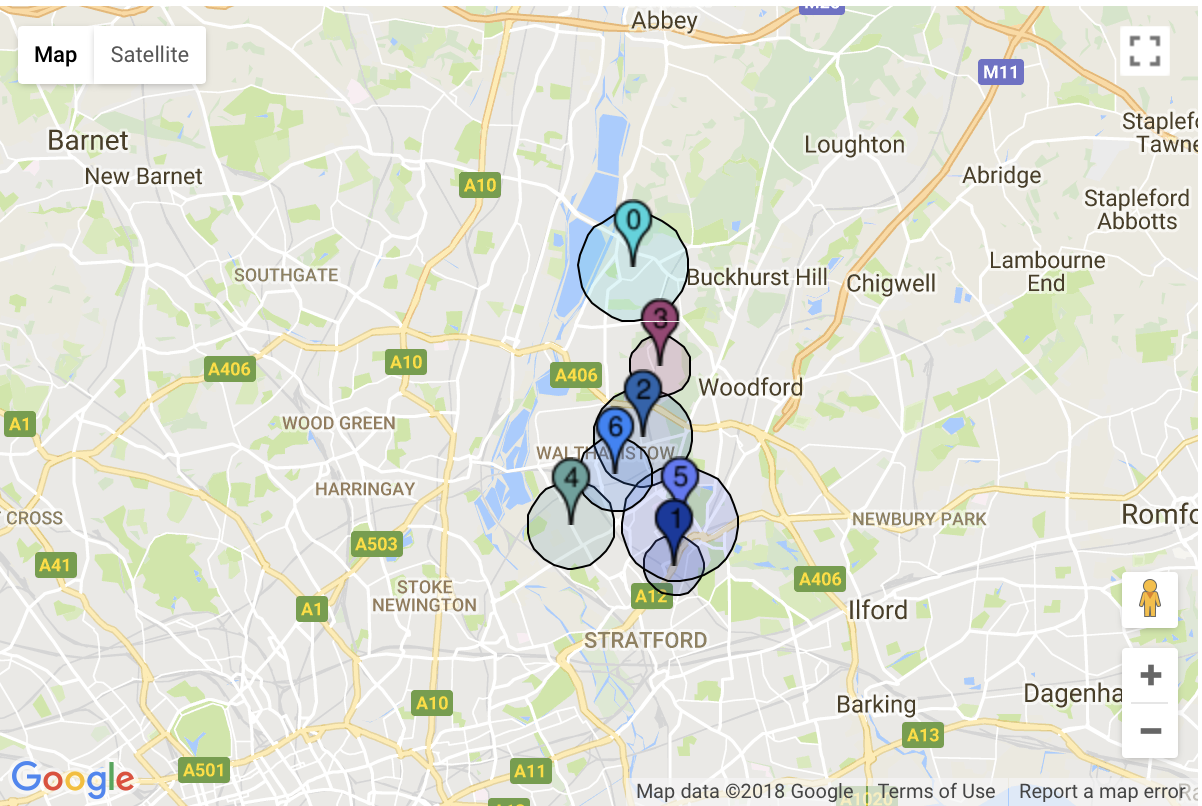
Circle overlays are useful for quickly and easily conveying quantitative information, by making the area proportionate to a known value of a variable at a given location. The area of a circle is a=πr2,so if the value to be mapped has value a, then the radius should be set to r=√(a/π).
Ground Overlay
Another form of overlay is a ground overlay, which allows us to place an
image over the map, which may be useful in some cases. The code below shows the
setup file for a map which uses a ground overlay. This is provided via google.maps.GroundOverlay().
The setup file is loaded by an HTML page similar to those used in our other
examples (groundoverlay.html).
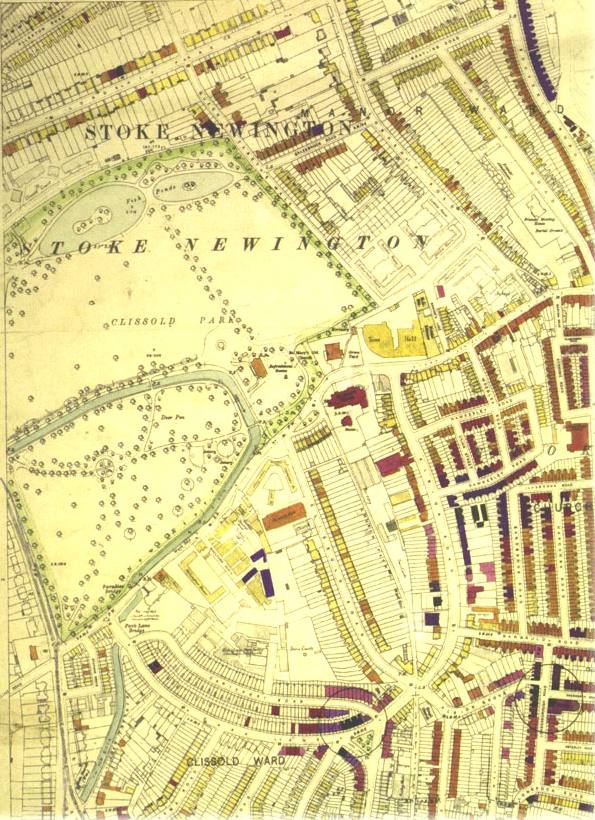
The map overlays a historic map of bomb damage in the London in the Second World War (bomb_crop.jpg) over the regular base map.
The code is relatively simple.
The code for groundoverlay_setup.js
/*

 * The starting position and initial zoom factor

*/


var centreLat = 51.5615;

var centreLong = -0.088;

var initialZoom = 15;

var map;


/*

 * init() function - this is where we start

 */

function init() {


   var latlng = new google.maps.LatLng(centreLat, centreLong);

   var myOptions = {

      zoom: initialZoom,

      center: latlng,

      mapTypeId: google.maps.MapTypeId.ROADMAP

   };

   var map = new google.maps.Map(document.getElementById("map_canvas"),myOptions);


   var imageBounds = new google.maps.LatLngBounds(

      new google.maps.LatLng(51.55546,-0.09130),

      new google.maps.LatLng(51.56590,-0.07980)

   );


   var myOverlay = new google.maps.GroundOverlay("bomb_crop.jpg", imageBounds);

   myOverlay.setMap(map);

}
Having done the usual map creation, we use
google.maps.LatLngBounds() to create a bounding box. This is defined by two
co-ordinates, the south-west and north-east points of a box; the points
must be given in this order. It is up to the developer to work out the
correct co-ordinates for the image to be overlain!
We then create the overlay, supplying two parameters: the name of an image
file (or a URL) and the bounding box that we have created. Finally, we add the
image to the map using setMap() as in most of our previous
examples.
Here's what it should look like:
The pattern of bomb damage can be easily seen, and the image remains present if the user switches to satellite view. Near the bottom right of the overlay image is a circle indicating a bomb impact location. A key attached to the original image noted colour coding of households, from total destruction (the darkest shades) to minor damage.
By default, the opacity of the overlay image cannot be altered, which limits
its usefulness; although this page
illustrates modifications which permit variation in opacity. It
would also be possible to add a button to the HTML page which linked its
'onclick' event to a JavaScript function that toggled the visibility of the
overlay.
One of the earlier examples showed how ward boundaries could be added to the map
as polygon overlays. However, only five generalised wards were used, and it was
noted that this was close to the practical limit as to the number of polygons
that could be added to a map. This is not ideal – clearly we may want to add
many polygons to a map.
One approach is to create a raster image that can be used as an overlay
layer, in which the raster image contains depictions of the polygons involved.
Using this approach, a large number of polygons can be rendered, although it
may be necessary to break up the raster image into a number of tiles.
[ Next: Using HTML to control JavaScript]
[Course Index]