
Using the Debugger
Although Python messages and print are a lot of people's first port of call, most IDEs supply tools that can help with debugging. These include underlining syntax errors before you run the code, and allowing you to jump to specific lines of code when Python points out that it is problematic. The most important of these tools, however, is undoubtably the "Debugger", especially its options for breakpoints, used in combination with variable explorers/watch lists.
Debuggers are reporting tools that hang on running code, watching what happens inside it, and allowing you to step through it a line at a time or more. Break-points allow you to control how many lines you run. Variable explorers (sometimes called Watch Lists) allow you to see the values of variables as code is stepped through.
While there are several libraries in Python for building your own debuggers (info), almost all IDEs come with one. We'll look at using Spyder. Open it up now.
Here's the finished and correct first file from the print practice: test1.py. Save it and open it up in Spyder.
We're going to recreate what we looked at in the print practice, using the debugger.
First, click somewhere on the data_floats.append(float(data_strings[i])) line. Press
F12 or go to the menu item Debug --> Set/Clear Breakpoint (with newer versions it might be under a sub-menu). You should see a red dot
appear in the margin of the line. Doing either
of those things again will make it go. You can also just click at that location to add the dot or remove it, which
is more the usual way of doing it, but it is a little sensitive to where you click, so needs practice.
This red dot is a breakpoint – in debug mode the code will stop running at this point when it is reached. Rather than running the code the usual way, press the blue "Debug file" button (it looks like a play and pause button together). This is on the debugging toolbar (circled on the image below):
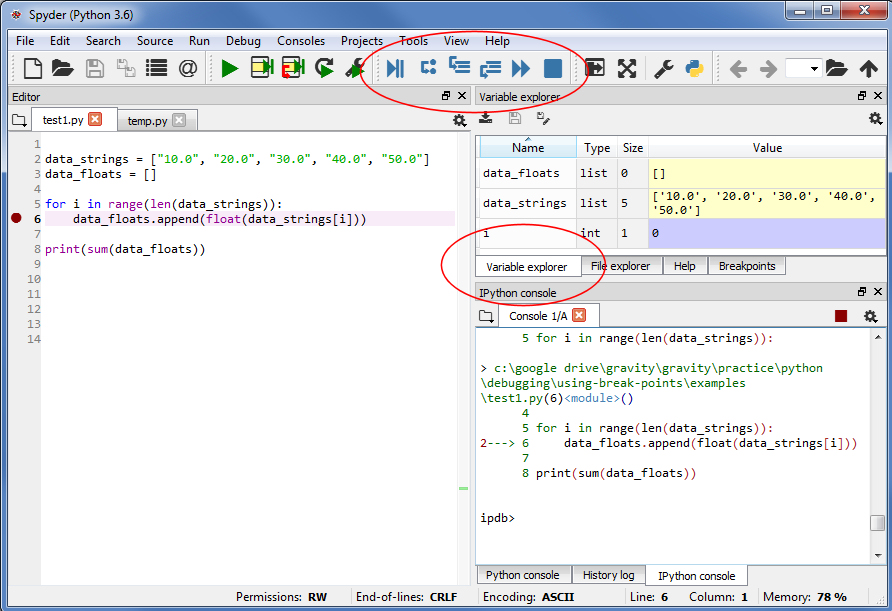
This starts the debugger, and positions it at the top of the file. Nothing has run yet.
Now make sure the "Variable Explorer" tab is at the front/showing in the "Inspector Pane": the window pane at the upper right of the IDE (the tab is also circled in the image above). If it is missing, you can show it using the menu under View --> Panes.
Now press the "Continue execution" button on the same toolbar (this is two left-pointing triangles, like a 'fast forward' button).
This steps on to the breakpoint, but doesn't run the associated line of code. Notice that the variables up to that
point have now been created, as the code making them has run. You should be able to see that
data_floats has nothing in it, as the breakpoint line hasn't run yet.
Push the "Continue execution" button again, and the execution will move to the next breakpoint. As it happens, as we're in a for-loop, that's the same breakpoint – we'll keep coming back to it until the looping has finished. You should see the variable values update, as the line has now run once.
Keep pressing it, until the program has ended. You'll see that this does some of the jobs our "print" did: it shows us the variable values, and kind of shows us where the code runs safely to (and would do that better if we added in breakpoints at the beginning of the loop).
You'll notice that during the debugging, the console prompt changed to ipdb> or pdb> depending whether you're in a iPython prompt or a standard one respectively. This is the debugger running; the latter is actually just one of the Python libraries we talked about earlier, and the former is the iPython integration of it. If it is still there after the program has run, try pushing the "Stop debugging" (blue square) button. This should put you back to the standard prompt (if it doesn't, you can type exit(); but chances are whatever you do next will start a fresh prompt).
The variables are probably still listed. If debugging is no longer running (i.e. the prompt isn't ipdb>), you should be able to select them with the mouse by clicking the top one and dragging down, and then right-click them and select remove. This will delete the variables from memory (otherwise they'll probably keep their values until the code runs again, which can be confusing). When ipdb/pdb has exited,
typing the following will also clear the variables (the -f suppresses a prompt to check you want to do it):
%reset -f
Command starting % are iPython "magic" commands, rather than standard Python; at the standard Python prompt you'd have to delete each in turn using del variable_name. However, a nicer solution is provided by "Carl" on this Stackoverflow thread, which is to add this to the
top of your code to do it automatically when the script runs:
from IPython import get_ipython

get_ipython().magic('reset -sf')
Just remember to delete it before distributing code to those with standard Python only.
Note that the debugger can be controlled from the Spyder prompt: typing h will bring up the commands, but key commands include n to move to the next breakpoint; b line_number to add a breakpoint to a line. You can find a summary for ipdb here and for pdb here.
You can run code through the pdb debugger from the standard command line outside of Spyder (details). Jupyter notebooks don't have a nice debugger interface, but there are ways of debugging it in beyond print (though print is useful), and you can run the standard pdb inside it. For more details see this blog post by David Manann.