GEOG5870/1M: Web-based GIS A course on web-based mapping
Task 2 - Introduction to PostgreSQL and pgAdmin
We have created a PostgreSQL database instance named 'geog5871' on the dialogplus.leeds.ac.uk remote server.
In this task you will:
- Create a connection to the geog5871 database instance.
- Interrogate the existing ‘tweets’ tables using SQL.
- Create your own table using additional data-sets.
Interfacing with PostgreSQL using pgAdmin
- Open pgAdmin now (available to install here if you are working at home, otherwise use the Windows search).
(Note: if you are installing this on your own machine and it is 64bit, you may need the Microsoft 32bit Visual C++ redistribution. The error you’ll see is along the lines of "msvcp120.dll not installed on your machine").
If you are accessing the server from outside the university OR are using a laptop in the university, before you attempt to log on to the server, make sure that you have activated the VPN.
Connect to the dialogplus.leeds.ac.uk server by first right-clicking 'servers' in the browser panel at the top left hand side of the page, then 'create > server' this opens a new dialog window.
In the 'Create-server' dialogue box, under the 'Connection' tab, enter the following credentials including the database username and password, remember this is different to your personal dialogplus username and password and is available from the 'usernames' file on Minerva:
In the general tab:
Name: geog5871In the connection tab:
Host name / address: dialogplus.leeds.ac.uk
Port: 5432
Username: XXX
Password: XXX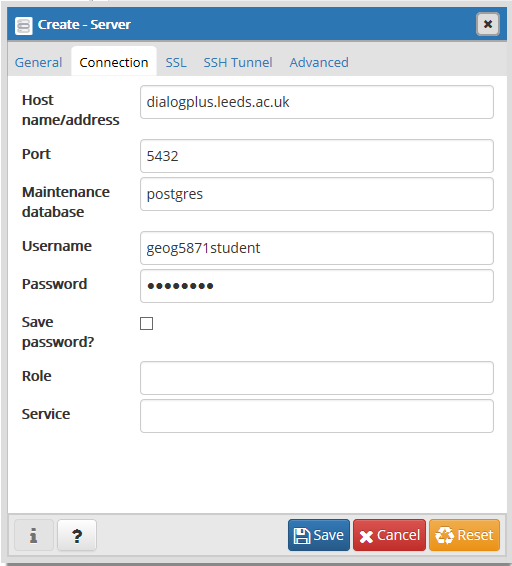
Click save and you should see the geog5871 connection in the browser panel.
pgAdmin has extensive functionality which makes it easy to query, edit and display data. Expand the geog5871 connection and view the different subdirectories enclosed within.
Find the 'tweets' table located in Databases > geog5871 > Schemas > public > Tables, and explore the data. How many columns are there? How many rows are there? Which column is the primary key (i.e. the list of IDs, unique to each row)? This data represents tweets that were collected during Hurricane Sandy. Unique usernames and anything else that may be used to identify an individual user has been removed and replaced with 'NA'. There are a number of other tables saved in the database from previous years. Explore these now to see what data is available to you (feel free to use these, but do not delete anything you haven't created and ensure you attribute any datasets you haven't used).
- Select Tools > Query tool from the top toolbar. This query builder allows you to query the data using Structured Query Language (SQL). There is also the option to use pgSQL; spatially enabled structured query language. Although this database is a PostgreSQL database, the data within it is not currently spatially enabled.
- Use the w3 schools web pages to work out how to build an SQL query to select all messages that were tweeted on day 30 of the sample. Make a note of the syntax you used.
- Build a further expression which selects tweets from day 30 of the sample which mention the word 'Hurricane'. You should also make a note of the syntax you used.
- As well as querying data from existing tables, you can also create your own tables within the database. Visit the spreadsheet page on the USGS webpage and download data in CSV format for all earthquakes which have occurred in the past month. Open this file in excel to view the data. Tidy up the spreadsheet so that only; 'time', 'latitude', 'longitude', 'depth', 'magnitude' and 'place' remain. You should also insert a column at the beginning of the spreadsheet and create a unique numeric ID for each record. I recommend starting at 1 in the first row and incrementing the number for each record (please don't do this manually!). Save the changes to the CSV file and close.
- In pgAdmin, right click on Tables in the left hand Object Browser and select Create > New Table. You now need to create a table definition for the Earthquake data. Add a title in the General tab, leave the schema as public and the tablespace as pg_default. In the columns tab, add a new column for each column in the dataset and choose an appropriate data type for each(choose wisely – we recommend numeric and varying character). Set a suitable length and precision for each field and set the ID as not null. Your tables will be saved in the same location, we recommend that you include your username in the title so you can identify your table once it has been created e.g. georo_earthquakes (Ensure that you use lower case for naming your table). Once happy with your table definition, click OK to create the table. It will be empty at this point.
- Highlight the newly created table and select Tools> Import/Export from the top toolbar. Check your table name appears in title of the window and Import the Earthquakes CSV file into the table. Select 'Header' checkbox and browse to your Earthquakes CSV file. All other options can be left as default.
- View the data to ensure it has imported correctly, you can make changes after creation via 'Table properties'. If you create a table incorrectly, or you are not planning to use it, please DELETE THE TABLE so as not to clog up the database.
- The SQL code (in text format).
- A screenshot of the code in the Query tool
- A list of returned results (the first few rows only - not the entire table).
- Select all tweets from the tweets table that were tweeted on day 30 of the sample
- Select all tweets from the tweets table that were tweeted on day 30 of the sample and include the keyword 'Hurricane'
- Select all records from your Earthquakes table which occured in Japan and have a depth greater than 70
- Select all records which fall within a geographical bounded area of your choice (a region that has tectonic activity!).
If you are using a computer on the University of Leeds network (or connected to the VPN off campus) you can connect directly to the PostgreSQL database instance on the dialogplus.leeds.ac.uk server through pgAdmin. pgAdmin is a free and open source administration and development platform for PostgreSQL.
Querying the Data
Creating a Table
Further queries - Portfolio submission
This task forms part of the portfolio submission. For each of the following use cases you should submit:
Import these elements into a word document and submit to Turnitin as part of your portfolio submission. Here are the use cases:
Hint: for the last query you will need to define an area using four sets of coordinates and select events which fall within these areas. Remember to tell me which area you have chosen in the text document (whether it's a particular country, continent of region).
[ Next: PHP: Hypertext Preprocessor ]