Near-repeat mapping
Dr Andy Evans
Repeat crimes
~31% to 76% criminals return to commit further crimes
Some rapidly return to the same victim (7-15% burglaries)
Some rapidly return to the same area (10-40% burglaries)
Some return to same area but over a longer time (hotspots)
Some crimes are 'slippery' - criminals repeat crimes slowly moving along streets
Townsley et al. (2003)
Near-repeats
Crimes clustered in space and time
Criminals return to an area over a few weeks until risk rises or reward drops
Might be thought of as an "optimal forager" strategy
If we can predict their return pattern we can prevent the crimes
Johnson & Bowers (2004); Bernasco (2008)
Analysis
Utilise Knox test
Work out distance between all event pairs in space and time
Put event pairs in a table where columns are time bins and rows space bins
| 1 week | 2 weeks | 3 weeks | 4 weeks | 5 weeks | |
|---|---|---|---|---|---|
| 100m | 40 | 30 | 10 | 0 | 1 |
| 200m | 35 | 20 | 5 | 0 | 2 |
| 300m | 10 | 10 | 5 | 5 | 0 |
| 400m | 10 | 5 | 0 | 2 | 0 |
| 500m | 0 | 5 | 2 | 0 | 1 |
Johnson et al. (2007)
Significance
'Monte Carlo' distribution
Take dates and randomly attach to places of events
Gives distribution where these are independent
Build 1000 of these
Rank observed cell contents vs randomised to see if in top 5%
Johnson et al. (2007)
Results
Most near-repeat crimes fall with 400m of last crime
Most fall within a month of the last crime
Prediction : Prospective mapping
Divided area into cells (smallest possible given computing)
Events within 400m of cell picked
Each event given weight from distance in space from cell centre and in time from the present
Cell given aggregate weight for events
Bowers et al. (2004)
Prediction : Prospective mapping
Gave the locations of 78% of crimes within the next week compared with 51% based on previous models
Also identifying smaller potential target areas
Solution is statistically rigorous, but complicated for implementers
Johnson et al. (2007)
Prediction : Trafford method
Simple 400m buffers around crimes
Colour the buffers by weeks-elapsed for three weeks
Separate graph plots of crime densities for each area by time of day
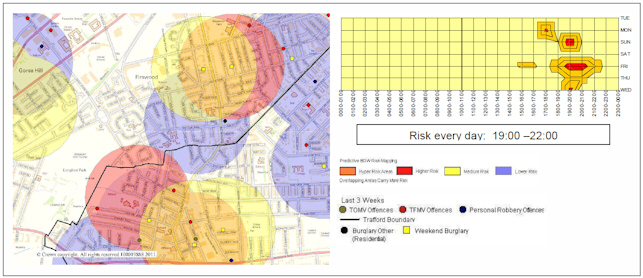
Fielding & Jones (2012)
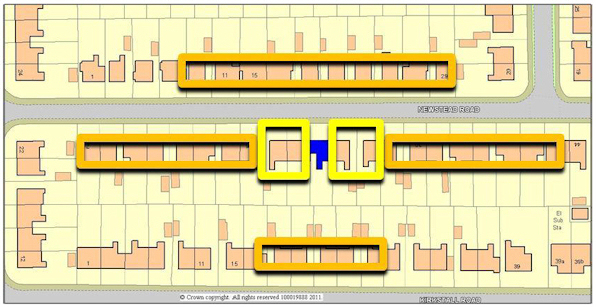
Prediction : Trafford method
Super-cocooning: target hardening and awareness raising in concentric forms around crimes
Trafford burglary down by up to 26%
Application
Determine critical scales
Prospective or Trafford methodology
Picks up repeat victimisation as well, but not general hotspots without time clustering
These are picked up by long term risk surfaces
Works best in high risk target- and environment-homogeneous areas