Summary: here we introduce a series of techniques that not only analyse data for patterns, but also utilise the behaviour inherent in that data in the prediction of crime. To an extent these techniques make explicit the assumptions about behaviour associated with risk modelling (that the nexus between people and environments causes repeated crimes in areas), but add detail to the assumed behaviour.
This page gives information on a series of methodologies that work well with offenders who return to the same areas each offence. This behavioural pattern is sometimes informally called the "Optimal Forager" pattern, as it matches up with what might be expected for offenders who work to ecological meta-behavioural models of that name in which behaviours develop minimising the energy outlayed to gather resources. In the UK the methodologies that target this behavioural pattern are sometimes known as "prospective mapping", following the first academic work in this area, or "the Trafford method" after the first area where it was sucessfully implemented by practitioners.
The methodologies essentially rely on the fact that some 31% to 76% criminals ( Bernasco, 2008) will return to the same area to commit crimes once they've been successful somewhere, and will continue in that area until returns drop or risk rises ( Shaw & Pease, 2000), causing a "offending spate" that clusters in both space and time ( Fielding & Jones, 2012). These "near-repeats" ( Morgan 2000) are, however, disinct from the repeat-victimisation pattern where a single property is targeted, or longer-term hotspots where environmental effects cause a consistent crime concentration (though the relationships are complicated, see Farrell and Sousa, 2001; Townsley et al., 2003). The patterns of near-repeats are strongest for burlgaries, but also occur with theft from vehicles; the pattern is distinct from, for example theft of vehicles, which clusters in space but not in a close time period ( Johnson et al. 2006), and repeat-victim crimes, for example domestic violence, where the repeat levels at locations vary considerably (for international figures, see Weisel, 2004). Although the idea of near-repeats was informally recognised by Shaw & Pease (2000) and Morgan (2000), the 'near-repeat' pattern was first solidly quantified by Townsley et al. (2003) and linked with optimal foraging by Johnson & Bowers, 2004a/b, who also discuss the notion that such crimes are "slippery", that is that they slowly move across target areas until the risk/reward ratio forces a move somewhere distant, if at all. As, in part, near-repeats are due to criminals recognising that there are similar targets, homogeneous areas at high risk of crime anyhow tend to have more near-repeats ( Townsley et al., 2003). Near repeats probably account for ~10-40% of all burglaries, while repeat victimisations (which are also caught by the techniques discussed here) account for some 7-15% ( Chainey, 2012, see also Polvi et al., 1991; Farrell & Pease, 1993).
This body of work essentially found that there is a distinctive pattern of crimes where there is a recurrence within a fixed distance of previous crimes (for UK cities ~400m) for ~a month afterwards. These crimes are usually also confined to the same time of day, though when that is may vary. Johnson et al. (2007) give a practical technique for identifying these distances and times utilising the Knox (1964) test of spatio-temporal clustering. In this test, the time and space distance between every pair of crime events in a region is calculated. These pairs are then allocated to a table, the rows of which represent increasing distance bins, and the columns of which represent increasing time bins. The bins used in the table are picked based on exploratory analysis and hypothesis testing.
| 1 week | 2 weeks | 3 weeks | 4 weeks | 5 weeks | |
|---|---|---|---|---|---|
| 100m | 40 | 30 | 10 | 0 | 1 |
| 200m | 35 | 20 | 5 | 0 | 2 |
| 300m | 10 | 10 | 5 | 5 | 0 |
| 400m | 10 | 5 | 0 | 2 | 0 |
| 500m | 0 | 5 | 2 | 0 | 1 |
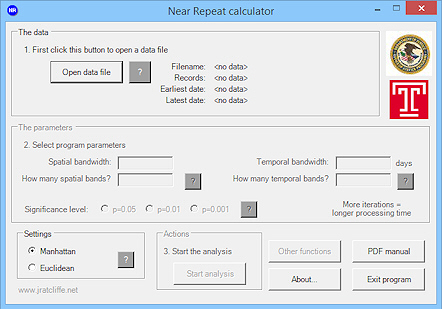
The distribution of event-pairs in the table is then compared with one assembled using a chance distribution. Johnson et al. generate the latter using a Monte Carlo sampling of the dates and locations separately, randomly combining the two pieces of data to create a new dataset where the two are more independent. They do this ~1000 times, generating a table for each, and then rank the observed value for each cell in the 1000 values generated as the randomised expecteds, essentially looking for those that are in the top 5% as those that are significantly high. These cells can then be highlighted to look at time-space distances that are significantly unlikely to be random. Once significant cells are recognised, a "Knox Ratio" can be calculated that compares the observed value to the mean or median of the expecteds, depending on the data skew (see Johnson et al., 2007, pp.4-6, for a discussion). A ratio of 2.0 would suggest twice the number of events than one might on average expect by chance. Ratcliffe (2009) has developed a downloadable tool to run this test based on the Monte Carlo distribution: download.
The identification of these key scales allowed researchers to develop an algorithm for identifying hotspots utilising short-term windows of time, rather than longer-term aggregations. Chief amongst these were, again, the team of Bowers, Johnson, and Pease et al. ( Bowers et al., 2004; Johnson et al., 2007) who developed a "prospective mapping" tool for identifying near-repeat targets based on developing a weighted risk surface formed using a moving window of the appropriate size. The area of interest is divided into cells of a specific size (recommended as the smallest possible given the computing power available), and the distance from the cell centre to each crime event is calculated, with those over 400m away discarded. Each event is then allocated a weight determined by its distance in space and in time from the present, and the cell allocated the aggregate weight value for all the events in the cell (the specifics of the weighting can be found in Bowers et al., 2004). Their Promap software based on this algorithm outpredicted previous methods based on long-term hotspots, identifying the locations of 78% of crimes within the next week compared with 51% based on previous models, while also identifying smaller potential target areas ( Johnson et al., 2007).
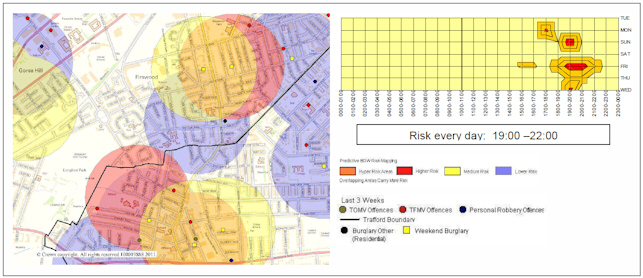
Johnson et al.'s (2007) solution is statistically rigorous, but complicated, and practitioners have developed alternative techniques based on the work which are simpler to implement and align with current practice, while also giving good results. Most notably Fielding and Jones (2012a) developed a solution based on simple buffering techniques which proved to be both possible to integrate with their practice as police intelligence analysts and which reduced burglaries in Trafford, Manchester, UK, by up to 26%. This "Trafford" method utilises simple 400m buffers around crimes, colouring the buffers by weeks-elapsed for three weeks. Each buffer captures what what Shaw & Pease (2000) informally noted as the "penumbra of risk". Because of the slippery nature of the crimes, more recent circles are a more reliable indicator than less recent crimes, as they are likely to pick up single criminals moving across an area ( Johnson et al., 2007). Multiple circles overlapping give a time-dependent colouring that allows for easy ranking of potential near-repeat and repeat crime areas. The overlapping areas of circles might be taken as given a higher probability of crime, in part if it indicates an area worked by a single criminal, but more reliably where multiple criminals are at work. The Trafford group additionally produced separate graph plots of crime densities for each area by time of day.
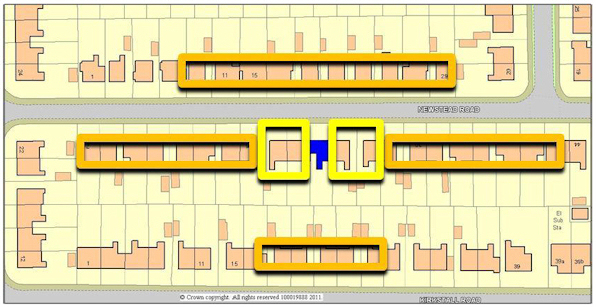
Following advise from Johnson et al. (2007), Fielding and Jones (2012a/b) built on work on target awareness and hardening associated with repeat burglary victims (e.g. Forrester et al., 1988; Chenery et al., 1997) combined with this new predictive information, to develop an practical process that embedded the maps at the centre of a new day-to-day officer patrol routine that maximised spare time spent within high risk areas. This has proved a popular methodology with both police management and officers, and has been adopted for testing in Leeds and Birmingham, where anecdotal and initial data analysis suggests it has brought considerable successes. In all cases, the local police have followed Mancester in utilised it with Pease's "cocooning" technique (target awareness and hardening for repeat victims, plus asking neighbours to keep an eye on the property) to create "super cocooning" ( Fielding and Jones, 2012b) - that is, target hardening in the previous target and neighbouring houses, along with awareness raising along the street in question ( Chainey, 2012; see also Pease, 1991, on cocooning more generally). This combined technique is likely to have good results where there is homogeneity of opportunity ( Pease, 1998; Townsley et al., 2003) and environmental structure doesn't disrupt circular buffers ( Fielding and Jones, 2012a).
Anderson, D., Chenery, S. and Pease, K. (1995), Biting Back: Tackling Repeat Burglary and Car Crime , Crime Detection and Prevention Series Paper No. 58. London: Home Office
Bernasco, W. (2008) Them Again?: Same-Offender Involvement in Repeat and Near Repeat Burglaries European Journal of Criminology, 5 (4), 411–431.
Bowers, K.J., Johnson, S.D., and Pease, K. (2004) Prospective Hot-spoting: The Future of Crime Mapping? The British Journal of Criminology, 44, 641-658.
Chenery, S., Holt, J. and Pease, K. (1997) Biting Back II: Reducing Repeat Victimisation in Huddersfield, Crime Detection and Prevention Series Paper 82. London: Home Office.
Chainey, S. (2012) JDI Briefs: Predictive mapping (predictive policing). UCL Jill Dando Institute of Security and Crime Science
Farrell, G. and K.Pease (1993) Once bitten, twice bitten: Repeat victimisation and its implications for crime prevention Police Research Group Crime Prevention Unit Series Paper No. 46 London: Home Office Police Department
Farrell, G. and W. Sousa (2001) Repeat Victimization and Hot Spots: The Overlap and Its Implications for Crime Control Crime Prevention Studies, volume 12, pp. 221-240
Fielding, M. and V.Jones (2012a) 'Disrupting the optimal forager’: predictive risk mapping and domestic burglary reduction in Trafford, Greater Manchester International Journal of Police Science & Management, 14 (1), 30–41
Fielding, M. and V.Jones (2012b) Repeat Victimisation – Road to Reduction Project summary for European Crime Prevention Network
Forrester, D., Chatterton, M. and Pease, K. (1988) The Kirkholt Burglary Prevention Project, Rochdale , Crime Prevention Unit Paper 13. London: Home Office
Knox, G. (1964) Epidemiology of Childhood Leukaemia in Northumberland and Durham. British Journal of Preventative and Social Medicine, 18, 17-24.
Johnson, S. D., & Bowers, K. J. (2004a) Stability of space–time clusters of burglary. British Journal of Criminology, 44, 55–65.
Johnson, S. D., & Bowers, K. J. (2004b) The Burglary as Clue to the Future: The Beginnings of Prospective Hot-Spotting. European Journal of Criminology, 1 (2), 237-255.
Johnson, S. D., D.J. Birks, L. McLaughlin, K.J. Bowers, & K.Pease (2007) Prospective crime mapping inoperational context: Final report, Home Office Online Report 19/07.
Johnson, S.D., Summers, L., and Pease, K. (2006) Vehicle Crime: Communicating Patterns of Risk in Space and Time. Report to the Home Office.
Morgan, F. (2000) Repeat Burglary in a Perth Suburb: Indicator of Short-term or Long-term Risk? Crime Prevention Studies, 12, 83-118.
Polvi, N., Looman, T., Humphries, C. and Pease, K. (1991). The time-course of repeat burglary victimisation. British Journal of Criminology 31 (4), 411–414.
Pease, K. (1991) The Kirkholt Project: Preventing Burglary on a British Public Housing Estate ( Project summary). Security Journal, 2 (2) 73-77
Ratcliffe, J.H., (2009) Near Repeat Calculator (version 1.3). Temple University, Philadelphia, PA and the National Institute of Justice, Washington, DC. August 2009.
Shaw, M., and K. Pease (2000) Research on Repeat Victimisation in Scotland: Final ReportEdinburgh: The Scottish Executive Central Research Unit.
Townsley, M., Homel, R. and Chaseling, J. (2003) Infectious Burglaries: A Test of the Near Repeat Hypothesis. British Journal of Criminology, 43 (3), 615-633.
Weisel, D.L. (2004) Analyzing Repeat Victimization POP Center Tool Guide Number 4, Center for Problem-Oriented Policing.