Agent Based Modelling
Dr Andy Evans
What are ABM?
What are the things to think about?
Background
To an extent developed from Cellular Automata (CA).
CAs are essentially a grid of cells which may be different states dependant on the conditions around them.
Each cell has a rule base determining how it reacts.
For example:
if a cell has less than two neighbours it dies,
if it has more than two it reproduces and the neighbouring cells come alive.
Can be used for searches, modelling crowds, ecosystems etc.
The Schelling Model
Classic CA, albeit initially paper-based.
Thomas Schelling (Harvard) looked at racial segregation.
Found that "even" if people were willing to live in areas made up of 50% other skin colours, segregation would develop.
1D CA. Cells either 1 or 0 ("black" or "white").
If neighbourhood > 50% of another colour, move to nearest area this isn’t true.
Issues
CA may appear to move, but actually flow of state changes for fixed cells. Means no historical record for moving features.
Agents freed up from the grid so they can move.
Interact with new neighbours and underlying environment as they do. Can build up knowledge and behaviours.
Coding an Agent
Agent Class:
Has an update method called each iteration, eg. move(), trade().
Has a position.
Has a list of all other agents and can get their position.
Can communicate with other agents if necessary.
Environment Class:
Has environmental conditions.
Calls the agents to update.
Object Orientated Programming makes this much simpler.
Picking rules
Can be given behavioural rules of a wide variety of types.
However, ideally we want a cognitive framework to embed rule-choice within.
Something that embeds decision making within a wider model of thought and existence.
Ultimately we have to trade off complexity of reasoning against speed of processing.
Belief-Desire-Intention
Most famous is the Belief-Desire-Intention model:
Beliefs - facts about the world (which can be rules).
Desires - things the agent wants to do / happen.
Intentions - actions the agent has chosen, usually from a set of plans.
Decision making
BDI decisions are usually made by assuming a utility function.
This might include:
whichever desire is most important wins;
whichever plan achieves most desires;
whichever plan is most likely to succeed;
whichever plan does the above, after testing in multiple situations;
whichever a community of agents decide on (eg by voting)
Desires are goals, rather than more dynamic drivers.
Issues
Abstract vs realistic
Memory and Power
Synchronisation - what order to agents work, and when
Calibration - how do we determine the parameters
Validation - how do we know it is working
Abstract vs realistic
Thought experiments
vs
Detailed complexity
Abstract vs realistic: Space
Boundary types:
Infinite.
Bound.
Torus.
Other topologies.
Organisation:
Continuous.
Grid (square; triangular; hexagonal; other)
Irregular areas, or quad-tree.
Network
Neighbourhoods:
Moore (square)
Von Neumann (diamond)
Diagonal
Euclidian
Network
Memory and power: memory
Geographical location (deg, min, sec, subsec, N, W): 8 ints = 256 bits
1 Gb = 33,554,432 people
This isn't including:
The fact that we need multiple values per person.
That we need to store the running code.
Maximum agents for a PC ~ 100,000 - 1,000,000.
Memory and power: power
Models vary greatly in the processing they require.
Individual level model of 273 burglars searching 30000 houses in Leeds over 30 days takes 20hrs.
Aphid migration model of 750,000 aphids takes 12 days to run them out of a 100m field.
These, again, seem ok.
Memory and power: power
a) Individual level model of 273 burglars searching 30000 houses in Leeds over 30 days takes 20hrs.
100 runs = 83.3 days
b) Aphid migration model of 750,000 aphids takes 12 days to run them out of a 100m field.
100 runs = 3.2 years
Ideally, models based on current data would run faster than reality to make predictions useful!
Solutions
If a single model takes 20hrs to run and we need to run 100:
a) Batch distribution: Run models on 100 computers, one model per computer. Each model takes 20hrs. Only suitable where not memory limited.
b) Parallelisation: Spread the model across multiple computers so it only takes 12mins to run, and run it 100 times.
c) Somehow cut down the number of runs needed.
Parallelisation
How do we divide up a model?
If memory limited, you have to divide the memory-heavy components, even if this slows the model. Sometimes it is better to get a model running slowly than not at all.
Otherwise, whichever reduces communication between processors - this is usually the slowest process.
If agents local and static, then divide geography.
If agents move lots but don't communicate, then divide agents.
Unfortunately, most models have agents that move and communicate so at some point you'll have to move agents between geography slabs or communicate with agents on other nodes.
Synchronisation
Clock
vs
Event based
Usual to randomise agent order.
Calibration
If you need to pick parameters, this is tricky. What combination of values best model reality?
Using expert knowledge.
Can be helpful, but experts often don't understand the inter-relationships between variables well.
Experimenting is lots of different values.
Rarely possible with more than two or three variables because of the combinatoric solution space that must be explored.
Deriving them from data automatically using AI/Alife techniques.
Validation
Can you quantitatively replicate known data?
Important part of calibration as well.
Need to decide on what you are interested in looking at.
Visual or "face" validation
eg. Comparing two city forms.
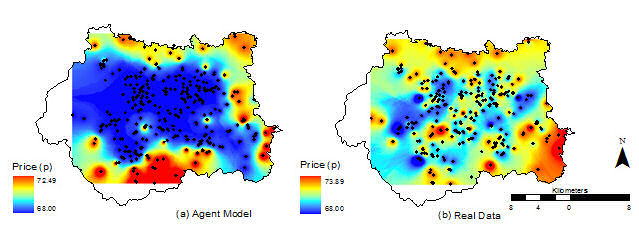
One-number statistic
eg. Can you replicate average price?
Spatial, temporal, or interaction match
eg. Can you model city growth block-by-block?
Total Absolute Error
If we're just predicting values, just take values in one dataset from another, and sum the absolute differences.
Comparison stats: space and class
Could compare number of geographical predictions that are right against chance randomly right: Kappa stat.
Construct a confusion matrix / contingency table: for each area, what category is it in really, and in the prediction.
| Predicted A | Predicted B | |||
|---|---|---|---|---|
| Real A | 10 areas | 5 areas | ||
| Real B | 15 areas | 20 areas |
Derive statistics from this.
Comparison stats
The problem is that you are predicting in geographical space and time as well as categories.
Which is a better prediction?
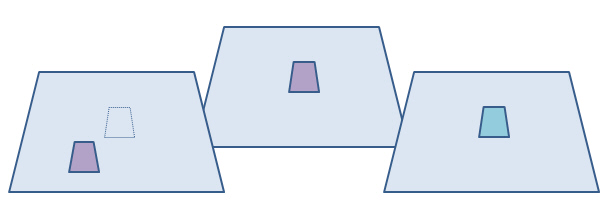
Comparison stats
The solution is a fuzzy category statistic and/or multiscale examination of the differences (Costanza, 1989).
Scan across the real and predicted map with a larger and larger window, recalculating the statistics at each scale. See which scale has the strongest correlation between them - this will be the best scale the model predicts at?
The trouble is, scaling correlation statistics up will always increase correlation coefficients.
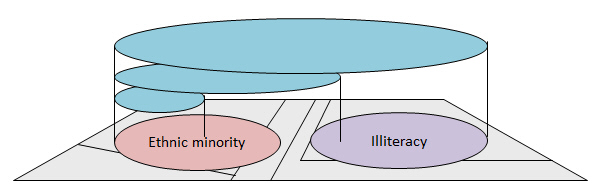
Correlation and scale
Correlation coefficients tend to increase with the scale of aggregations.
Robinson (1950) compared illiteracy in those defined as in ethnic minorities in the US census. Found high correlation in large geographical zones, less at state level, but none at individual level. Ethnic minorities lived in high illiteracy areas, but weren't necessarily illiterate themselves.
Comparison stats
So, we need to make a judgement - best possible prediction for the best possible resolution.
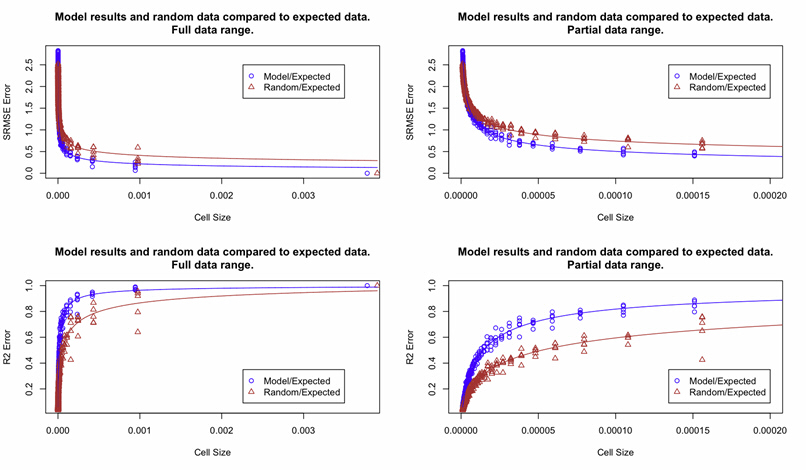
Validation
If we can't get an exact prediction, what standard can we judge against?
Randomisation of the elements of the prediction.
eg. Can we do better at geographical prediction of urban areas than randomly throwing them at a map.
Doesn't seem fair as the model has a head start if initialised with real data.
Business-as-usual
If we can't do better than no prediction, we're not doing very well.
But, this assumes no known growth, which the model may not.
Errors
Model errors
Data errors:
Errors in the real world
Errors in the model
Ideally we need to know if the model is a reasonable version of reality.
We also need to know how it will respond to minor errors in the input data.
Sensitivity testing
Tweak key variables in a minor way to see how the model responds
The model maybe ergodic, that is, insensitive to starting conditions after a long enough run.
If the model does respond strongly is this how the real system might respond, or is it a model artefact?
If it responds strongly what does this say about the potential errors that might creep into predictions if your initial data isn't perfectly accurate?
Is error propagation a problem? Where is the homeostasis?
Monte Carlo sampling
It is also the case that if we have input data repeatedly entering the model, this can lead to harmonic artefacts.
In addition, we'd like to understand the range of responses to errors in input data.
We may need some randomisation to make the model more realistic.
In general we sample input data randomly, even if we act to include certain periodicities (e.g. seasonal). We sample weighted by distribution - so-called Monte Carlo sampling.
Running the model multiple times generates a probabalistic output distribution.
Analysis
Models aren't just about prediction.
They can be about experimenting with ideas.
They can be about testing ideas/logic of theories.
They can be to hold ideas.