Agent-Based Modelling and Big Data
Dr Nick Malleson
School of Geography, University of Leeds
http://nickmalleson.co.uk/
http://www.geog.leeds.ac.uk/people/n.malleson
Background: Need for data
ABM is a fantastic tool for exploring complex systems
But we are often let down by data
Limitted information about daily behaviour
Difficult / impossible to properly validate individual-level models
'Big Data' might offer a solution
The Big Data "Revolution"
There is an abundance of new data
90% of the world's data has been generated in the last two years ( Science Daily)
The amount of data is doubling every two years (EMC).
Total data will hit 8 zeta bytes by 2015 ( Silicon Angle).
It is changing the way that we view the world

In the physical sciences:
"Data intensive science" (e-science) (Gray, 2007)
Astronomy - Data are pooled in Virtual Observatories (VOs)
CERN Large Hadron Collider "CERN does not have the computing or financial resources to crunch all of the data on site" (CERN)
The Big Data "Revolution"
In business
Loyalty cards etc - greater knowledge about customers
E.g. predicting pregnancy and telling your parents! (take with a pinch of salt)
Hidden value to 'secondary' / 'exhaust' data
Online browsing behaviour
Re-Captcha (digitising books)
Street view (Google self-driving car, improved mapping, wireless locations)
The Big Data "Revolution"
In medicine:
Do mobile phones cause cancer?
Mobile phone data (Danish Cancer Society)
N≈all - all cancer data and almost all mobile phone users (3.8 million person years)
If you want to know whether mobile phones cause cancer, have a look at the study: http://www.bmj.com/content/343/bmj.d6387
Abundance of patient data
When patients take multiple drugsm unexpected interactions can occur
Tatonetti et al. (2011) mine FDA adverse event reporting system (AERS) data.
Find unexpected relationships between combinations of drugs and glucose levels
Google Flu Trends (Nature, 2009)
Identify particular search words linked to emergence of a flu cluster
Able to predict new clusters rapidly (1 day vs. 1-2 weeks with traditional methods)
(More recent accuracy is questionable)
The Big Data "Revolution"
In the social sciences:
"Datafication" (Mayer-Schonberger and Cukier, 2013)
friends, favourite places, moods, thoughts
Location as data
(particularly relevant to geographers)
'Crisis' in the social sciences
Example: Research with Twitter
Aim: can we use twitter to better understand routine activities?
Obviuos relevance to crime research
Surge in volume of contributions to social media
66% of online adults use social media (Smith, 2011)
100 million active Twitter accounts in 2011 (Twitter, 2011)
270,000 tweets per minute produced worldwide in 2012 (TechCrunch, 2012)
Accurate time stamps and (occasionally) spatial location
Combination of text, media, location, etc.
Leeds Twitter Data
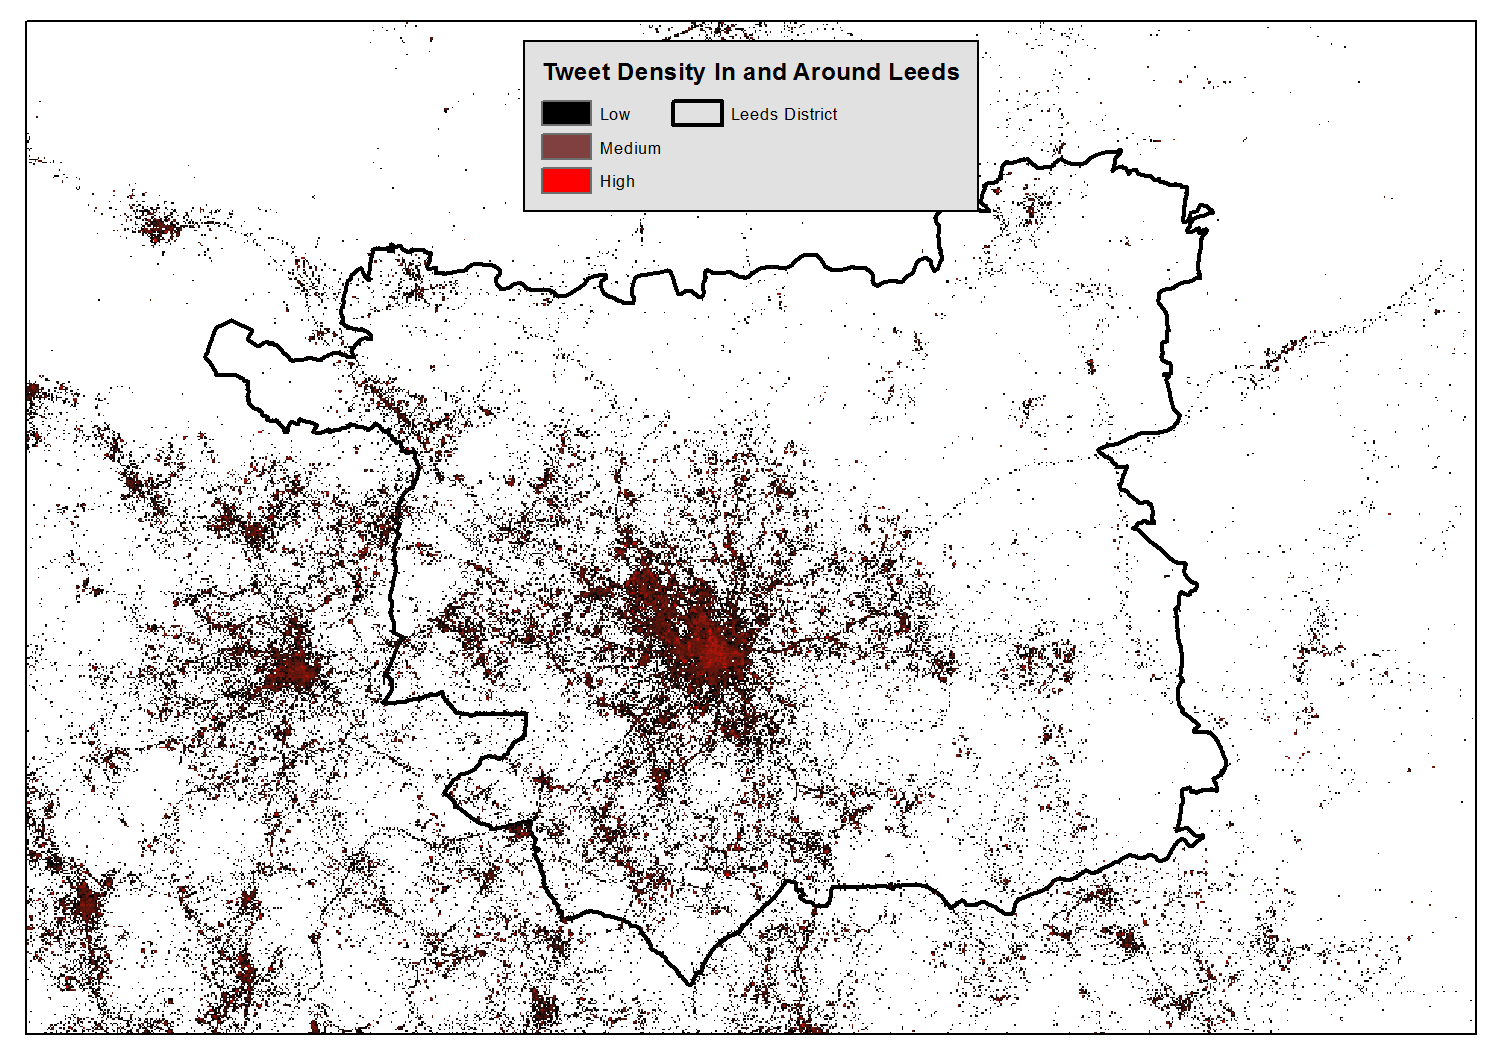
Leeds, UK
Population 757,655 (in 2012)
Central shopping / leisure / commercial area
University and students
Social media data
Geo-located Twitter messages from 22 June 2011 to 14 April 2013
N=1,955,655 (after cleaning)
Two research directions:
1 - Simulating daily urban movements
2 - Populations at risk of street crime
Simulating daily urban movements
To begin with: Using twitter data to better understand how people use urban spaces
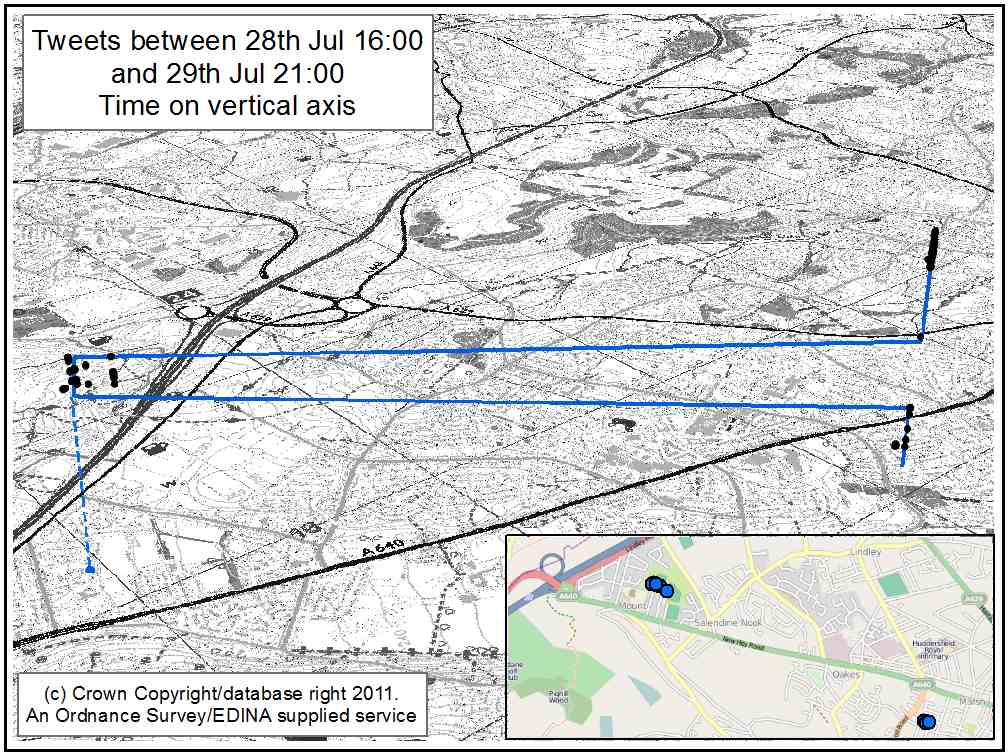
Stage 1: Extract prolific users
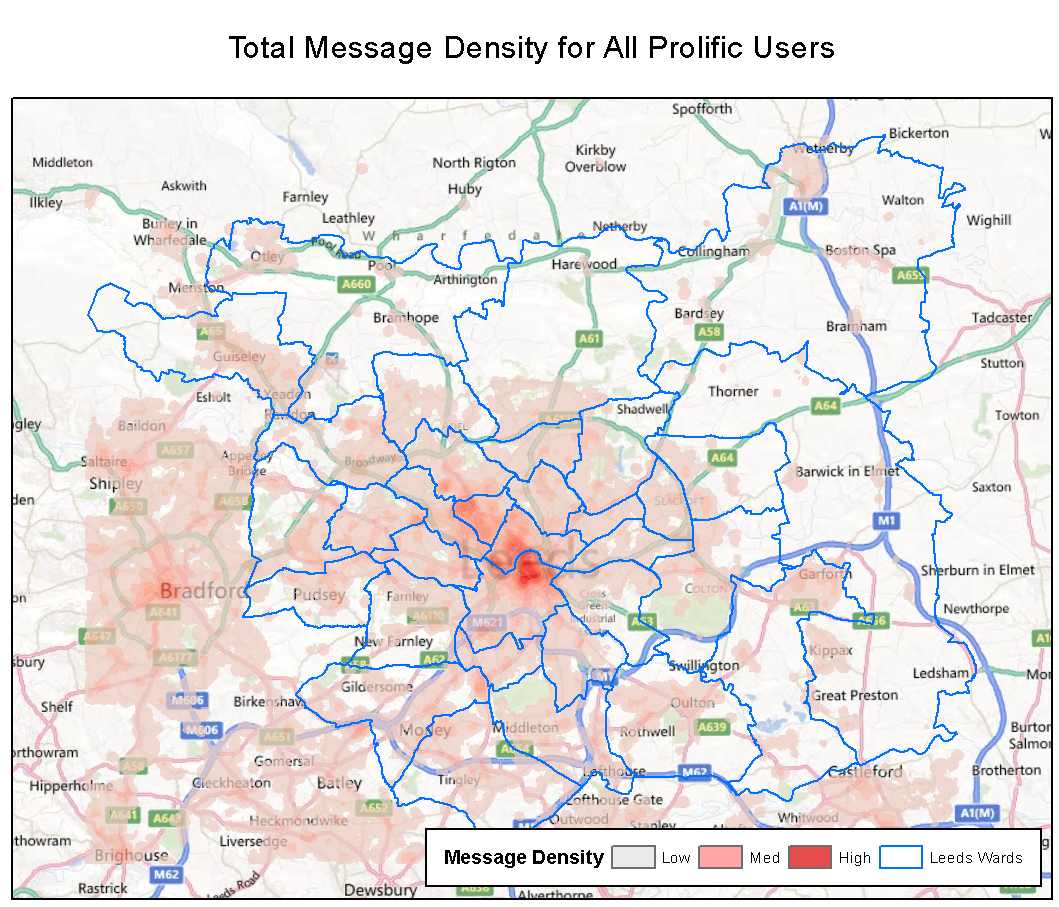
Simulating daily urban movements
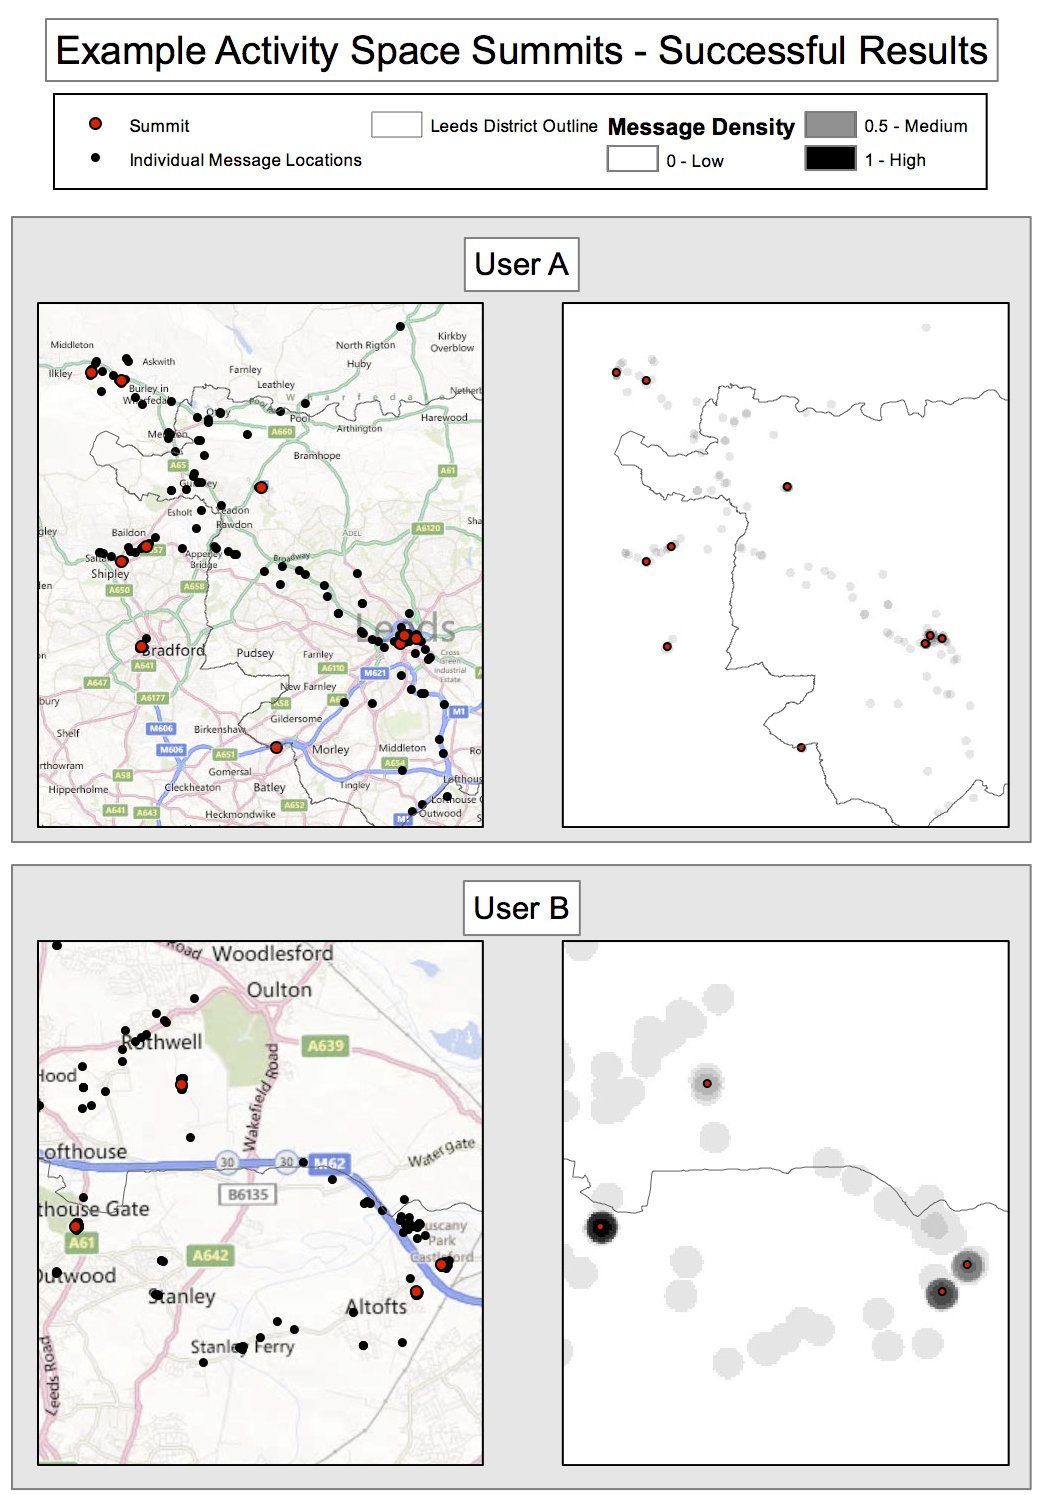
Stage 2 - Generate a message density surface
Kernel density estimation
Highlight areas with high spatial message density for individual users
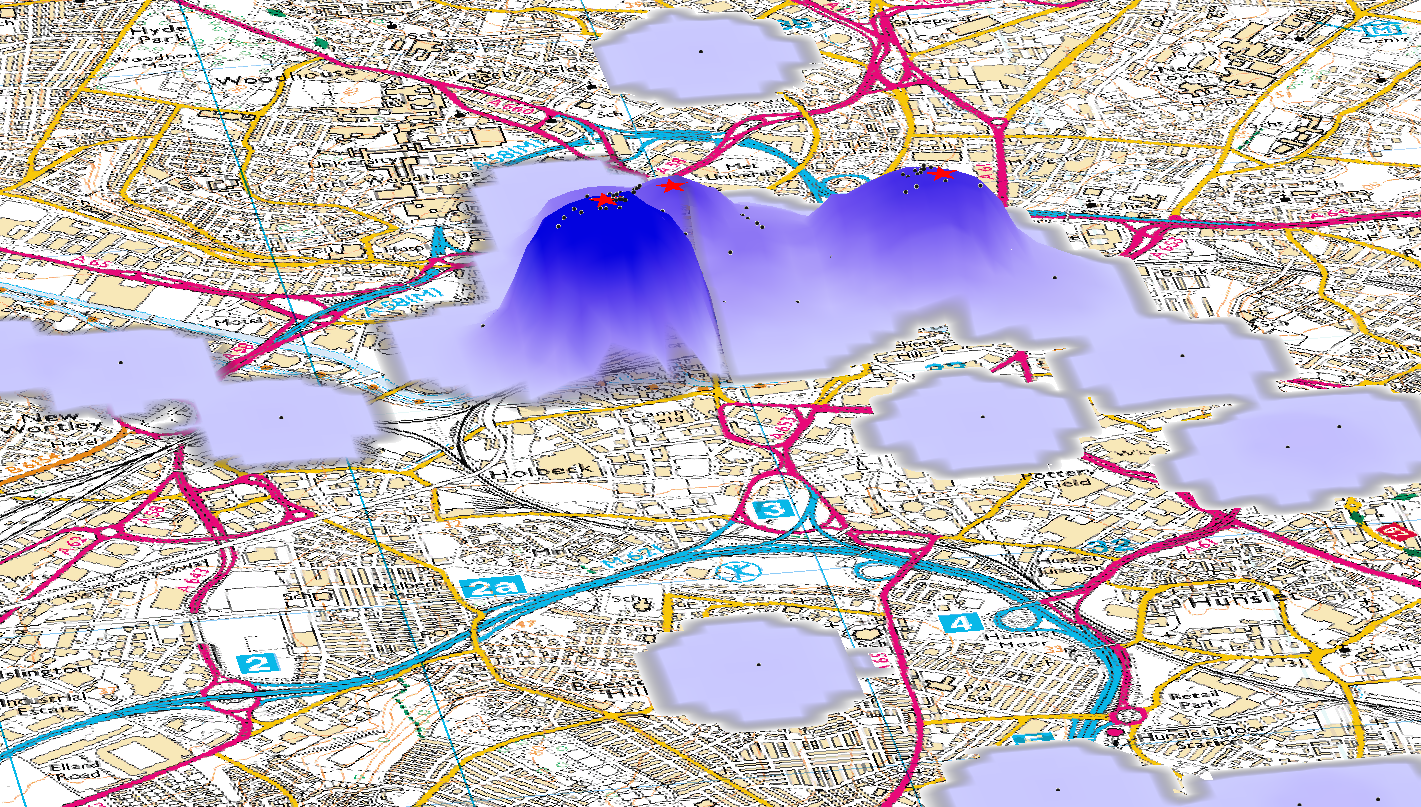
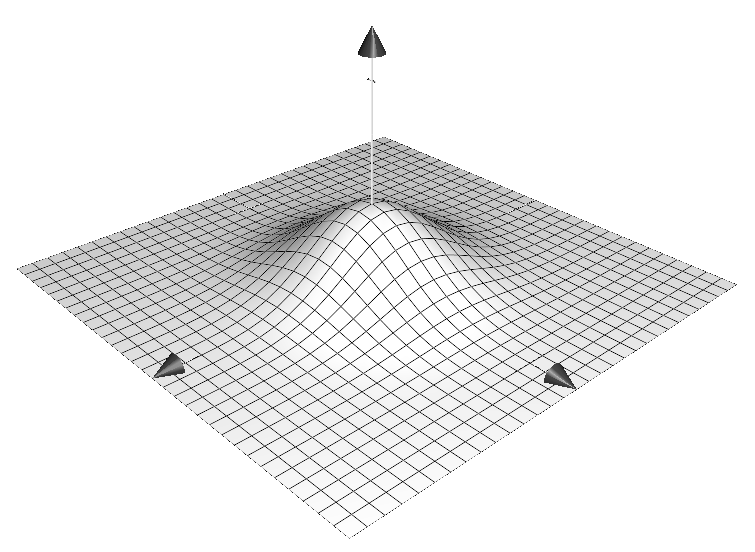
Simulating daily urban movements
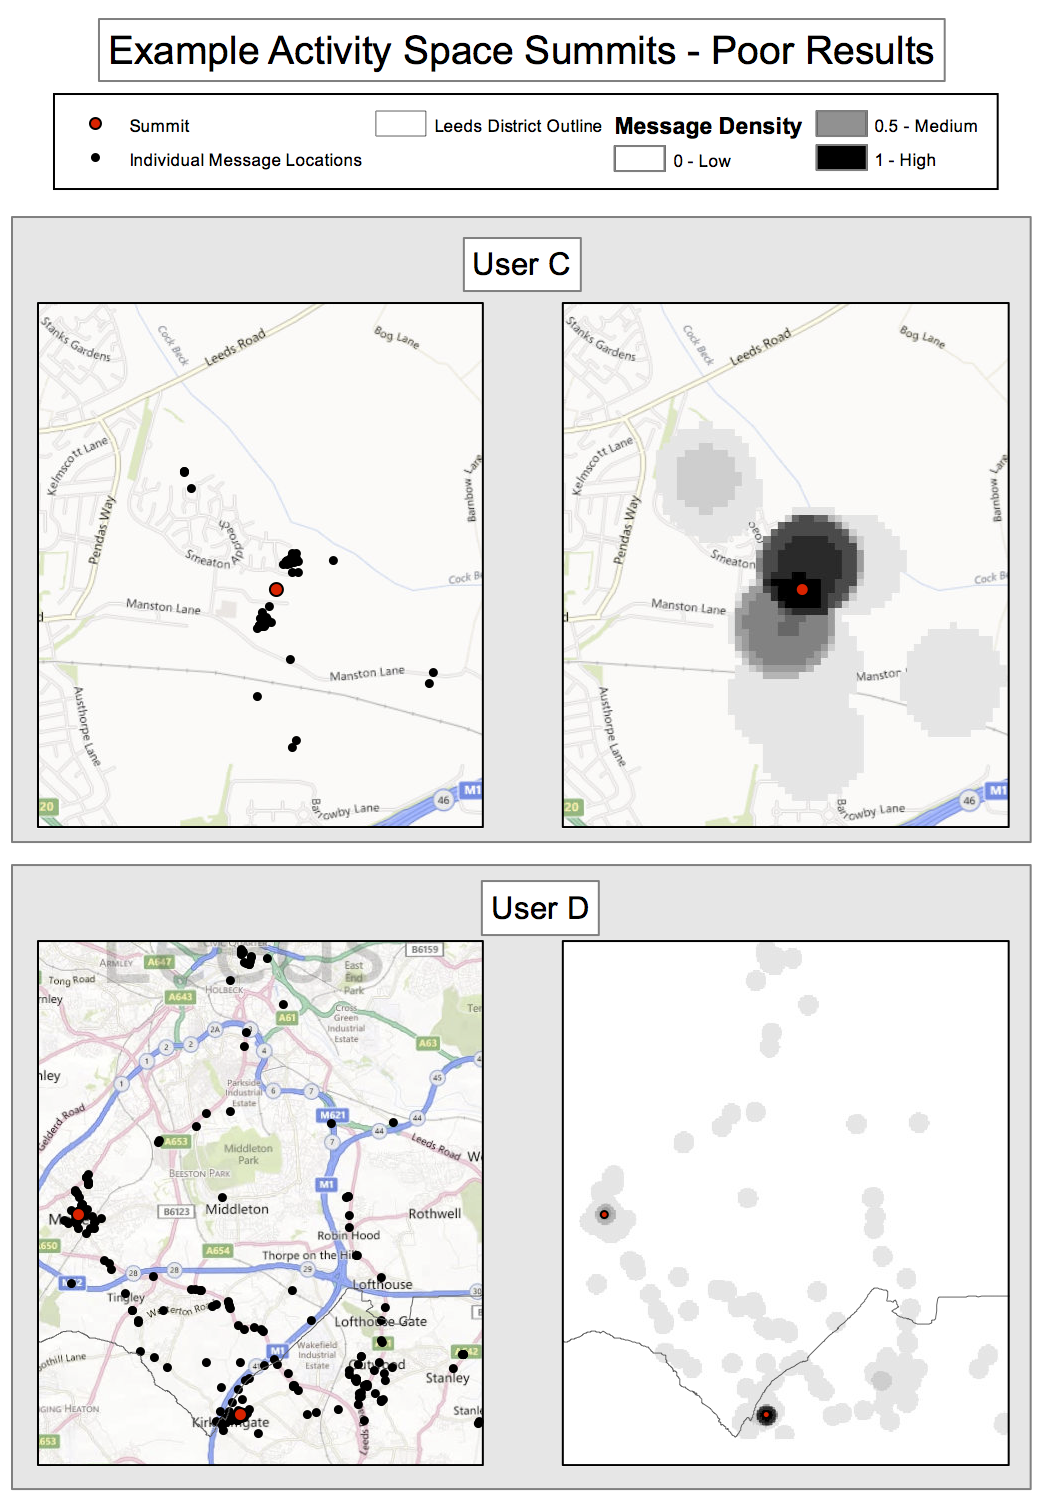
Stage 3 - Identify areas of 'unusually' high density (anchor points)
GIS method used to identify peaks in digital elevation data
Use Landserf free software (Java) [11]
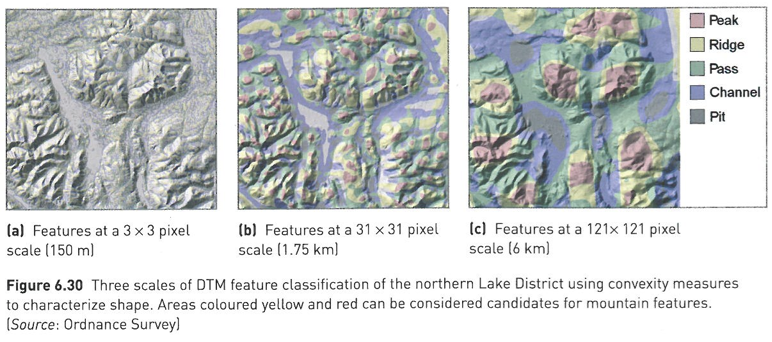
Anchor points are centres of peaks
Assume highest peak is 'home'
2 - Populations at risk of street crime
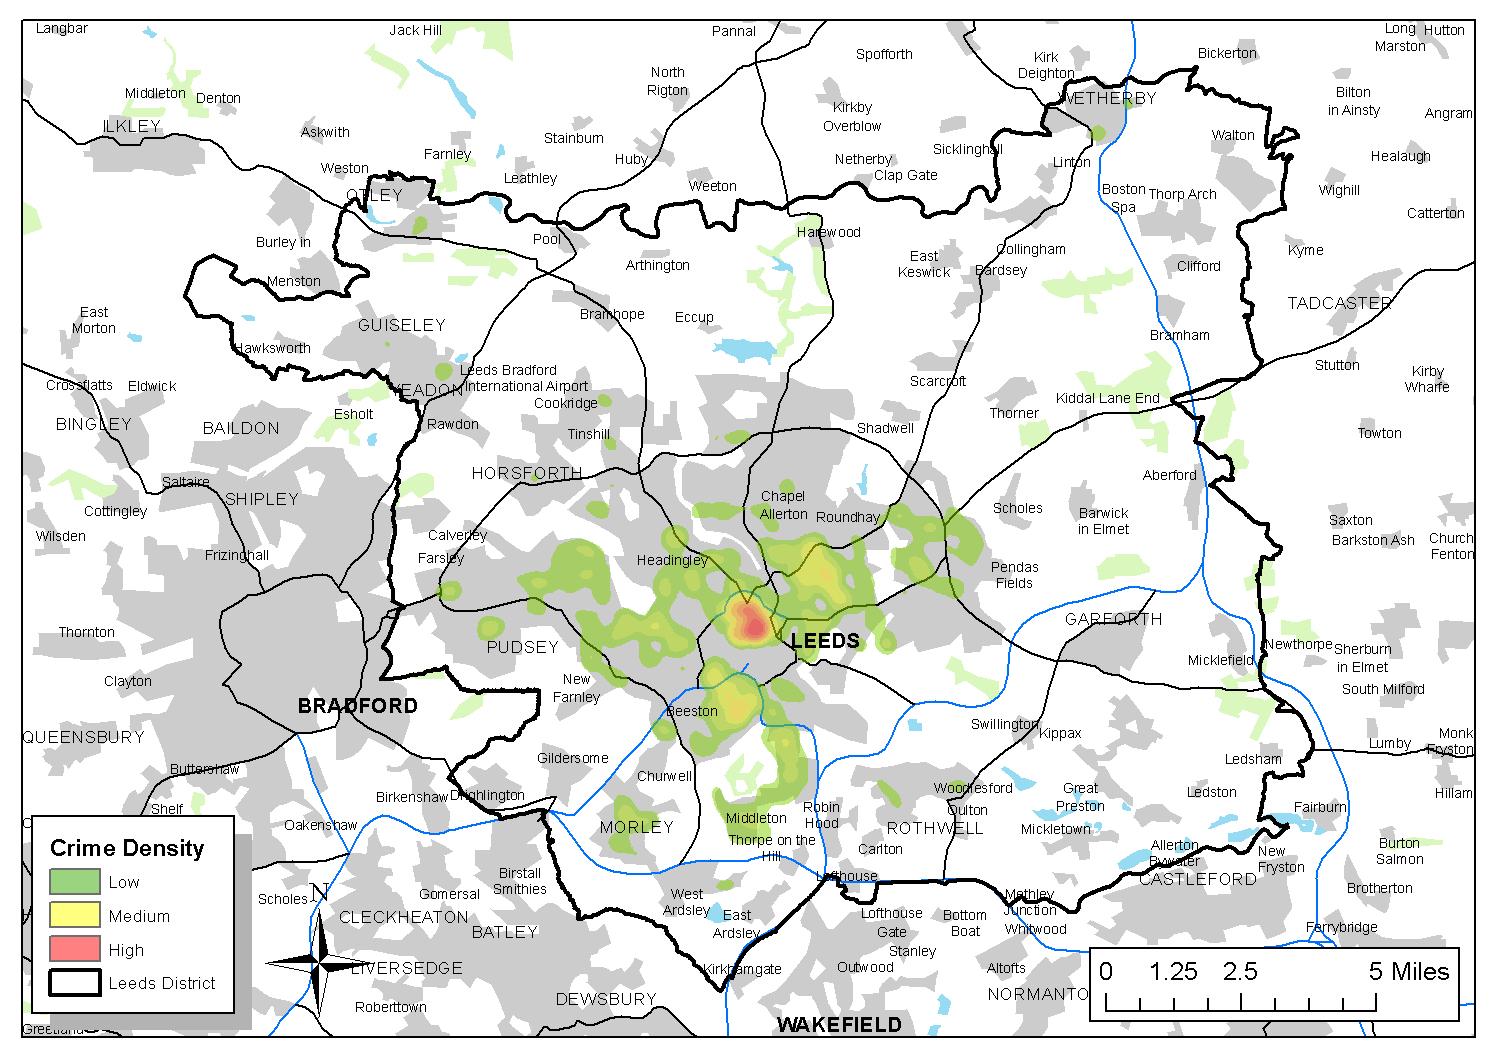
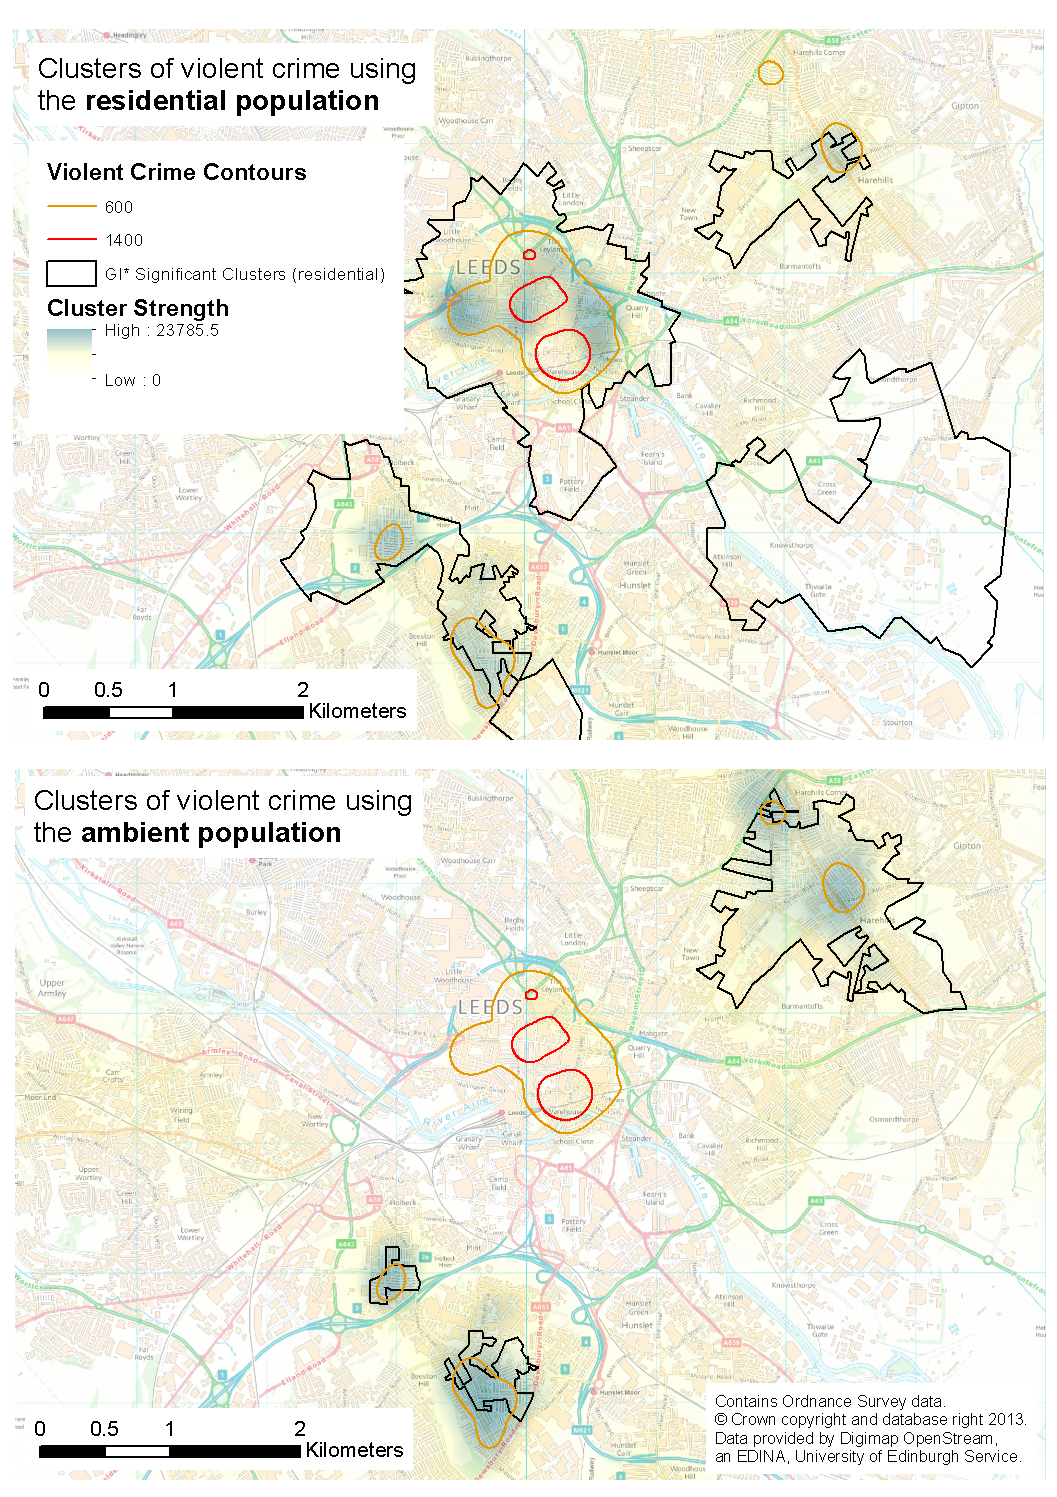
Are crime hot spots stable under the application of different population-at-risk measures?
Which areas have the highest crime rates when using both residential (census) and mobile (social media) population at risk data?
The Population-At-Risk in Crime Analysis
The population at risk is fundamental for crime rate calculations
CrimeRate = Crime Count / Population At Risk
No consensus on the best population-at-risk measure to use
“a valid rate ... should form a probability statement, and therefore should be based on the risk or target group appropriate for each specific crime category” (Boggs, 1965)
Usually default to residential population
Residential Population
OK for some crime types
E.g. Burglary
But not for many others. E.g.:
Assaults (Boivin 2013)
Robbery (Zhang et al. 2012)
Violent crime (Andresen 2006, 2011)
Why residential?
Data availability and resource constraints
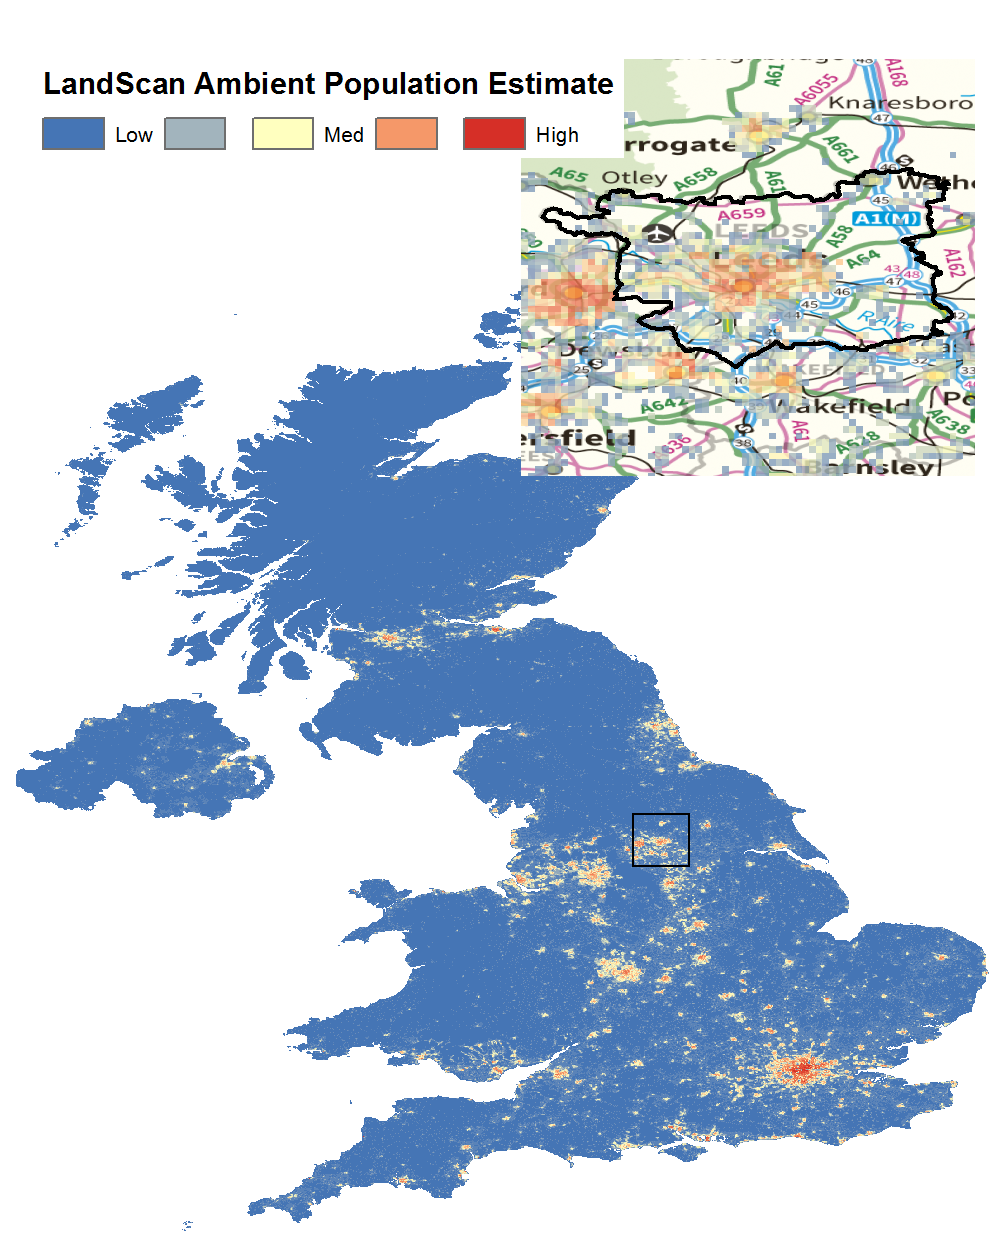
More recent attempts to estimate the ambient population:
Proxies (Boggs, 1965). E.g. car park locations, pavement area, etc.
LandScan data (Andresen et al. 2012). Global estimates of average (24hr) population, resolution ~1km2
Social Media - Limitations
Messiness / Noise
Not gathered using systematic / statistically guided methodology
Omissions are commonplace
No systematic corrections
Generalisability
The digital divide
E.g. higher socioeconomic status groups are over represented in Twitter and Flickr (Li et al., 2013)
Bias
Over-representation of the most prolific users
Or certain activities
Research with Social Media: Conclusions
Lots of limitations, but considerable potential:
Biased at present, but use of social media is rising
Important methodological progress
Best available data?
Considerable investment from the Government and Research Councils. E.g. the Consumer Data Research Centre at Leeds
Ethical Implications

Risks
How to align 'Big Data' with
informed consent
privacy and data protection
dual use
non-discrimination
Risks of abuse (big brother)
E.g. "Surveillance ... has challenged and undermined the right of all humans to "remain unobserved and unmolested" in their thoughts, personal environments and communications." (The Guardian, 2013).
Conclusions
Abundance of new data
Business already exploiting new sources
Potentially use these data to better understand society
.. and to inform crime models
Big questions around data protection, privacy, ethics and surveillance.