GEOG3150 Semester 2
Lecture 9
Understanding Models through their Patterns:
Statistics, Visualisation and Complexity.
Dr Nick Malleson
Dr Alison Heppenstall
Click here for full screen
About these slides
These leture slides work in two dimensions; sometimes you have to press the 'down' arrow to find additional slides explaining a particular topic. You can press 'escape' to zoom out and see all the slides that are available.
The slides with voting windows on them wont work after the lecture, as we will have finished voting! You will just see a blank window.
Recap: ABM and Geography
Reasons to model:
Explanatory
Predictive
The reason for modelling will influence your decisions over the modelling environment
Different types of 'geography'
Grids
Continuous space
Social network?
GIS

Recap: ABM & GIS
Loose coupling
The GIS and the model do not interact directly
Tight coupling
The GIS and model are integrated
Loose coupling is more efficient and flexible, but it can make interacting with the model more difficult.
Recap: Simulation for Policy Modelling

Pedestrian modelling
Fluid dynamics / social forces
Magnetic model
Agent-based crowd models
Traffic modelling
Examples of spatially realistic models
Abstract models were surprisingly successful
Recap: Simulation for Policy Modelling
Steven J. Lansing and water management in Bali
Attribution: Nick Leonard (CC BY-NC-SA 2.0)
This Lecture: Understanding Models through their Patterns
About the patterns produced by models in their results:
methods that can be used to identify 'important' patterns in multi-dimensional space;
what these mean in terms of causality (i.e. how they have been caused by a model);
how patterns can be used to inform our understanding of real systems.
We're 'flipping' the classroom, so it is going to be much more interactive than normal
Preparation was to read:
Evans, A., A. Heppenstall and M. Birkin (2013) Understanding Simulation Results. In B. Edmonds and R. Meyer (eds) Simulating Social Complexity. Springer. [Available on the VLE: http://tinyurl.com/oq4bh64 ]
This is the hardest lecture, covering the most advanced topics. So don't worry if it takes some time to understand all the material.
So how is this 'flipped classroom' thing going to work?
1 - I ask a question, you think about it in silence
2 - We do a poll to see what everyone thinks
3 - You spend a few minutes discussing the results of the poll and try to persuade each other what the correct answer is.
4 - Poll again
5 - If lots of people still get the answer wrong I'll talk for a few minutes, otherwise we'll move on.
Question 1 - Causality and Emergence
The authors suggest that:
The concept of emergence is essentially a sign of our ignorance of the causal pathways within a system.
In other words, if we had massive brains we could run simulations in our heads and simply see how individual-level behaviours lead to emergent patterns (i.e. cause and effect).
Question 1 - Causality and Emergence
In a complex system, which direction does the path of causality flow:
1. From the individual to the aggregate
2. From the aggregate to the individual
3. In both directions
4. WTF?
Think about this in silence for a few minutes.
Vote at: http://www.polleverywhere.com/nickmalleson
Poll
Discussion
In a complex system, which direction does the path of causality flow:
1. From the individual to the aggregate
2. From the aggregate to the individual
3. In both directions
4. WTF?
Discuss the answer with your neighbour(s) for a few minutes. Which is the right answer? Is there a right answer?
Some definitions: (by Nick) might help
Causality: the relationship between cause and effect
Causal pathway: the path taken from cause to effect.
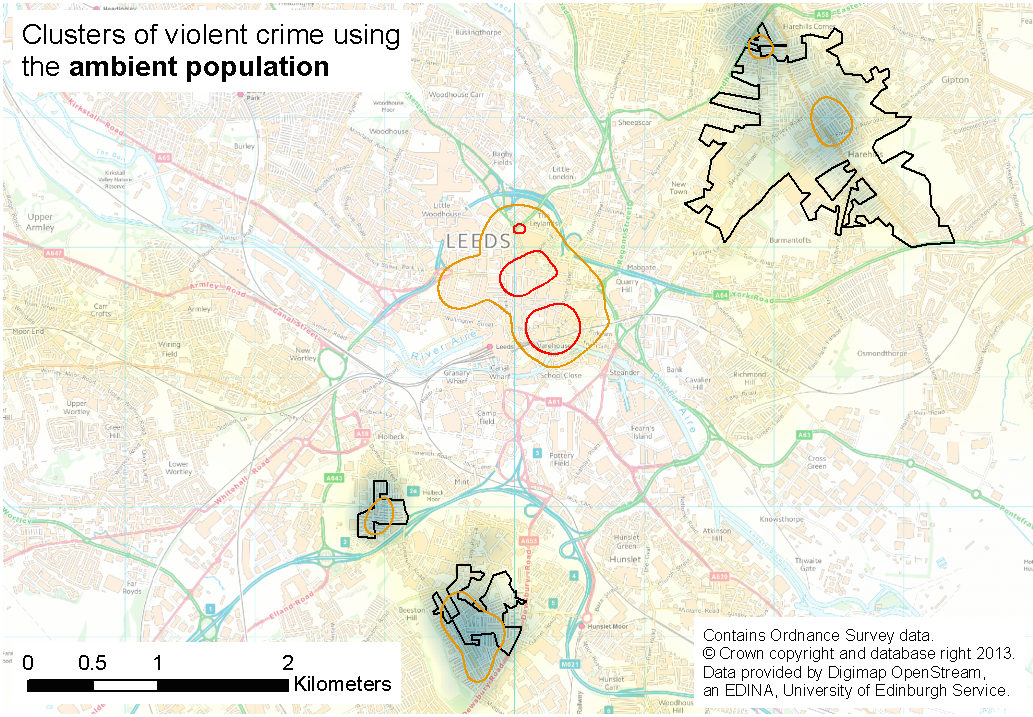
E.g. in the festival model, the 'causal pathway' leads from the individual (agents) to the aggregate (crime patterns)
Remember the butterfly effect?
Poll again
Question 2 - Recognising Patterns with Statistics
Data produced by models of complex systems can be voluminous, multi-dimensional and extremely complicated.
Capturing the movements of agents in a 3D system produces huge amounts (1 entry per agent per itetation) of 4D data (x, y, z, time).
This makes it very difficult to detect 'interesting' patterns
Fortunately there are methods that can be used to reduce the dimensionality of the data and aid pattern recognition
For example, clustering algorithms highlight areas with unusually high/low numbers of occurrences.
Question 2 - Recognising Patterns with Statistics
Which of the following methods tells you about the overall amount of clustering in your data.
Nearest-Neighbour statistics (e.g. Nearest Neighbour Index, G, F, K)
Spatial auto-correlation statistics (e.g. Moran's I and Geary's C)
Local Indicators of Spatial Association (e.g. GI*, Geographical Analysis Machine)
Space-time scan statistics
Think about this in silence for a few minutes.
Poll
Discussion
Which of the following methods tells you about the overall amount of clustering in your data.
Nearest-Neighbour statistics (e.g. Nearest Neighbour Index, G, F, K)
Spatial auto-correlation statistics (e.g. Moran's I and Geary's C)
Local Indicators of Spatial Association (e.g. GI*, Geographical Analysis Machine)
Space-time scan statistics
Discuss the answer with your neighbour(s) for a few minutes. Which is the right answer? Is there a right answer?
Poll again
Question 2 - Recognising Patterns with Statistics
Examples
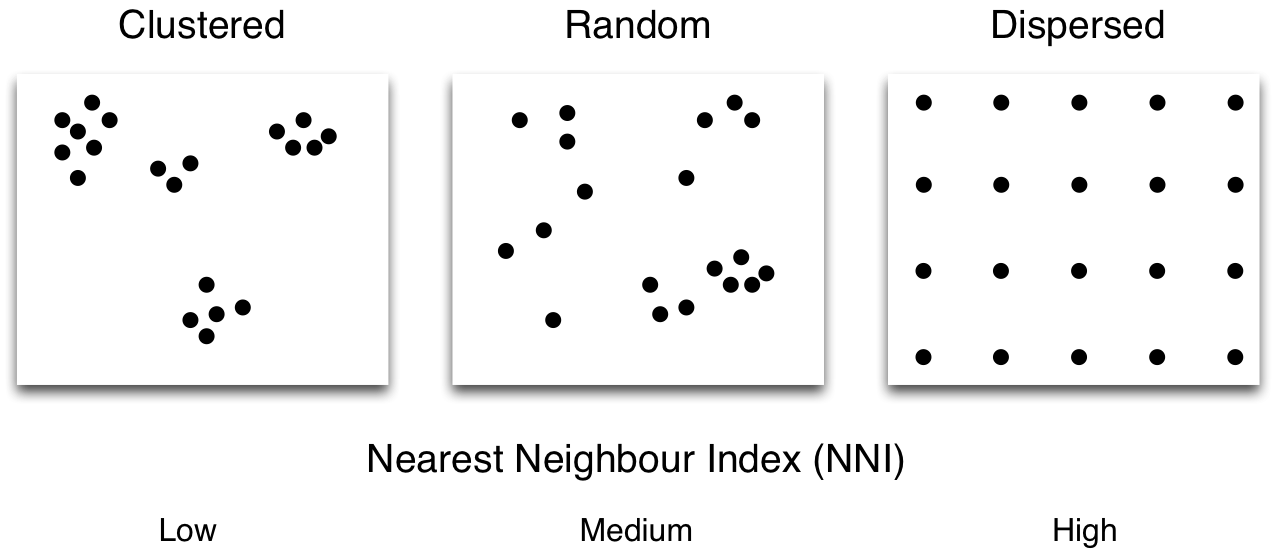
Nearest-Neighbour Statistics
Compares average distances from one point to its nearest neighbour.
Tells you about overall clustering / dispersion in the data (NNI)
Can be extended to show clustering at different scales (G and F functions)
Spatial Autocorrelation
Everything is related to everything else, but near things are more related than distant things
Spatial autocorrelation:
a variable is correlated with itself through space
Positive: Nearby values are simlar to each other
Negative: Nearby values are different (unusual)
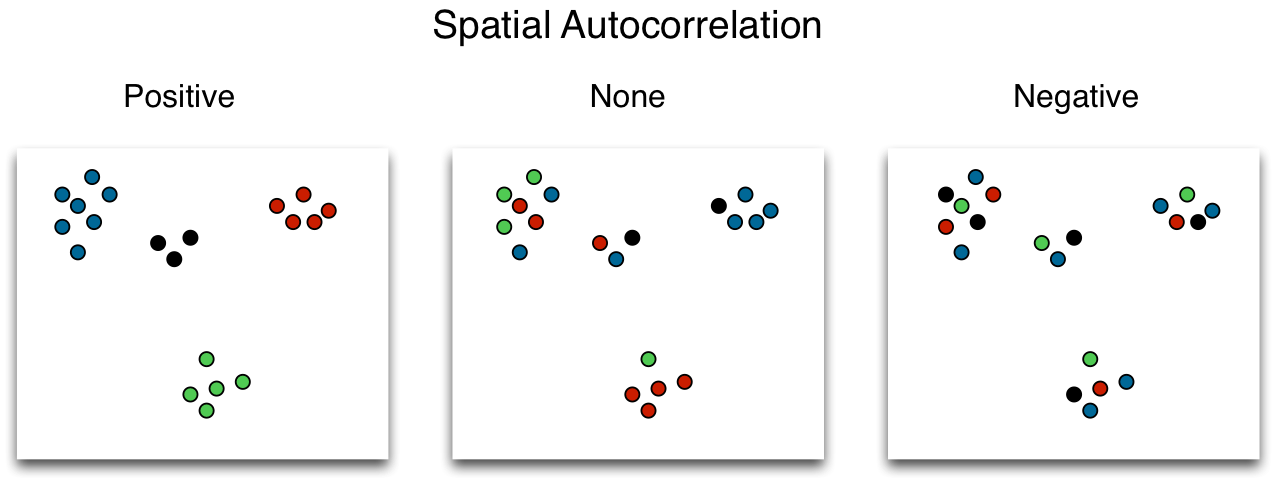
Common statistics: Moran's I, Geary's C, Ripley's K
Local Indicators of Spatial Association
AKA clustering statistics
Identify locations with a statistically significant high/low number of occurences
Examples: GI* (Getis and Ord), GAM (Stan Openshaw)
Space-Time Scan Statistics
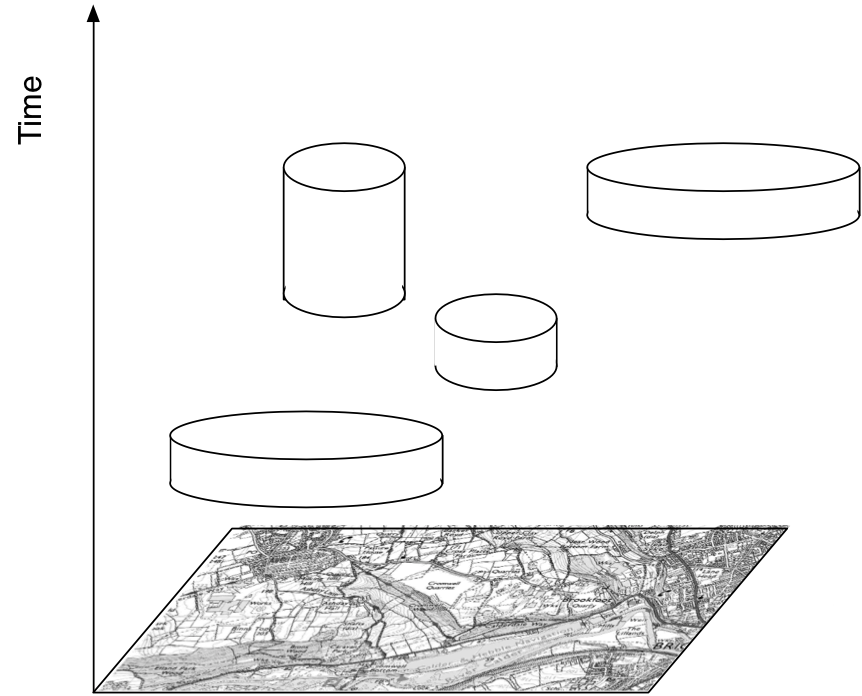
Look for clusters of events in space and time.
Commonly applied to search for clusters of disease outbreak
Pass a cylinder over the events in space-time (3D)
Question 3 - Visualising Patterns
The tools that we have developed over some time ("2500 years"!) are poorly suited to exploring the detail associated with individual-level data.
Visualisation is a powerful means to understand these data as it aims to exploit the ease with which we (humans) recognise patterns.
Common techniques include:
Time series data
Choropleth maps
Rose diagrams
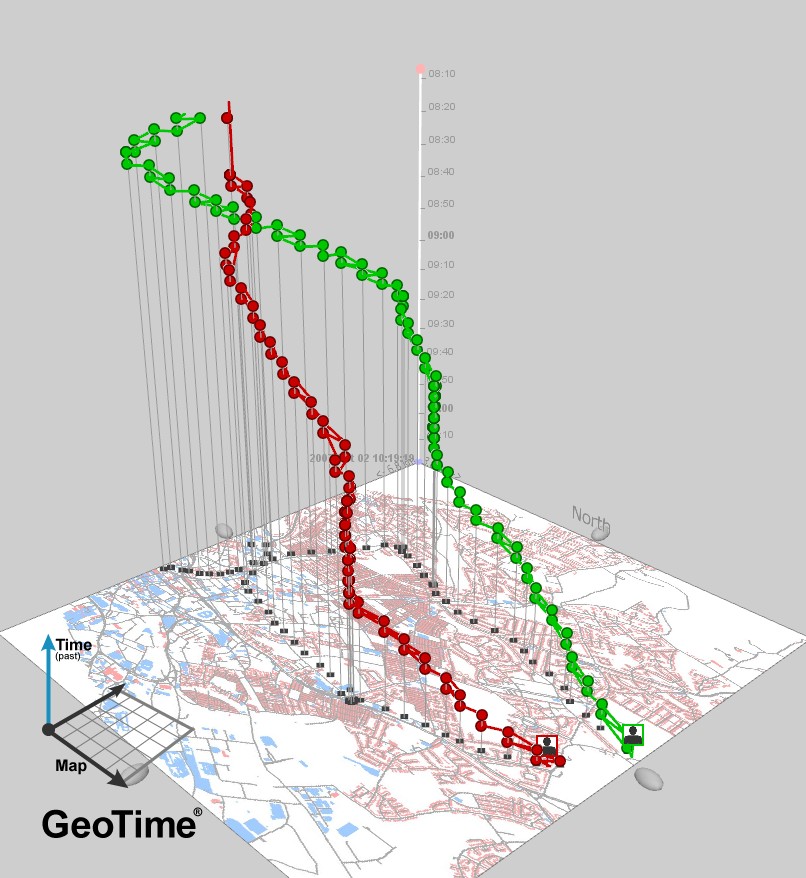
Space-time cube
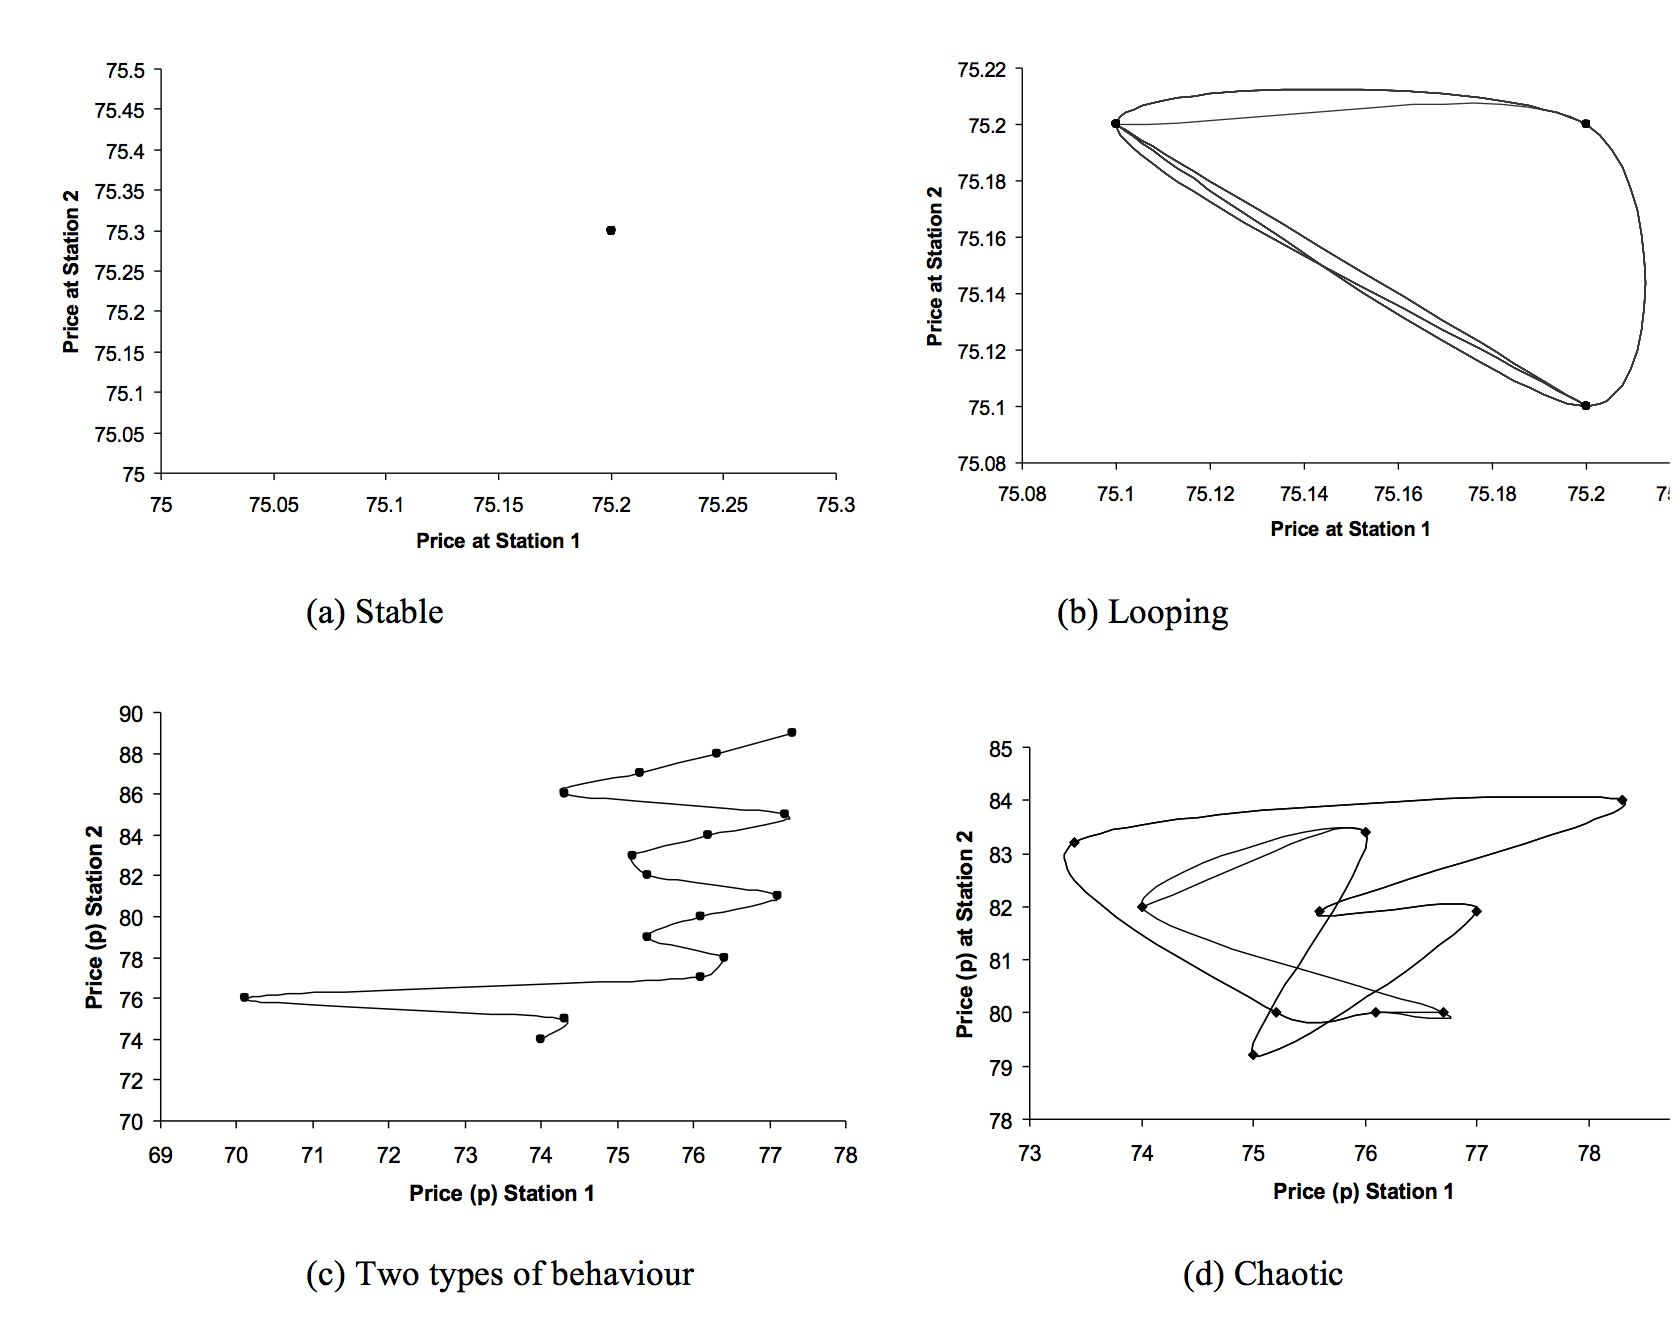
Phase maps
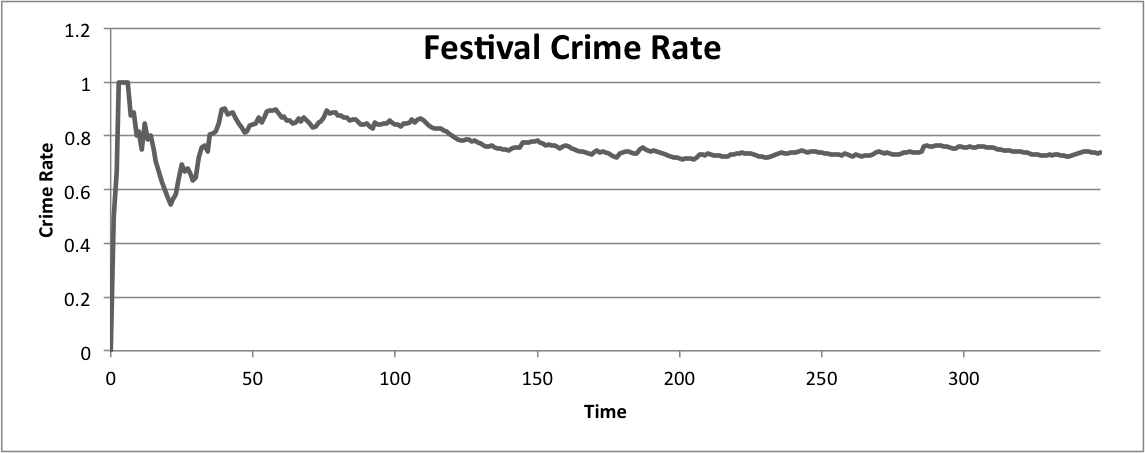
Time Series Data
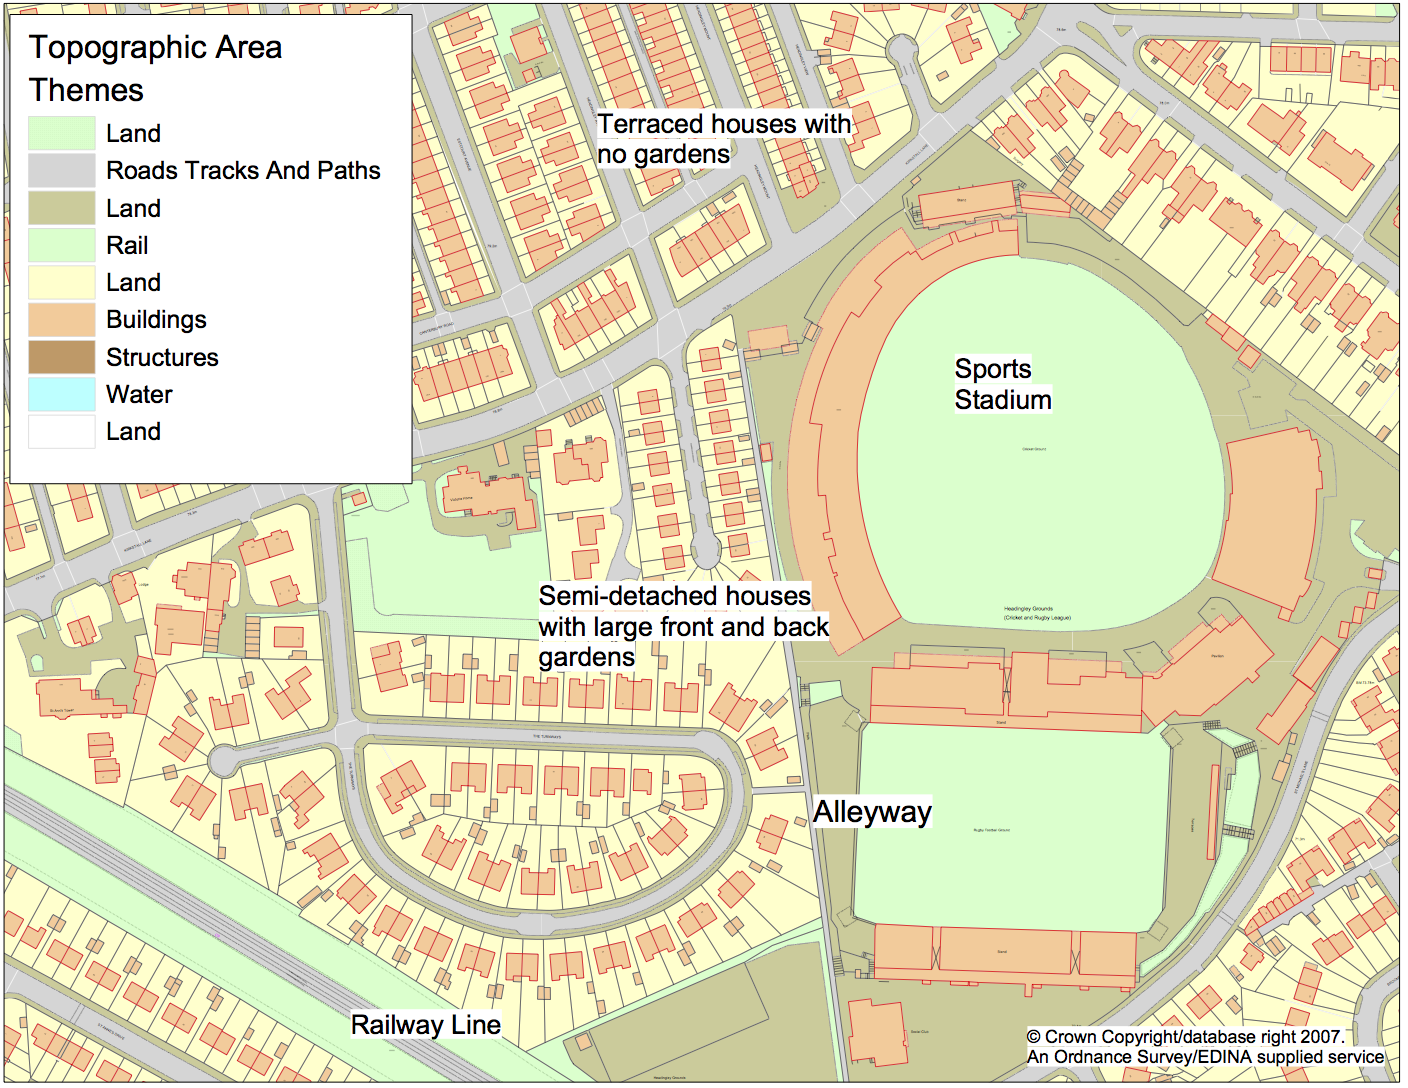
Choropleth maps
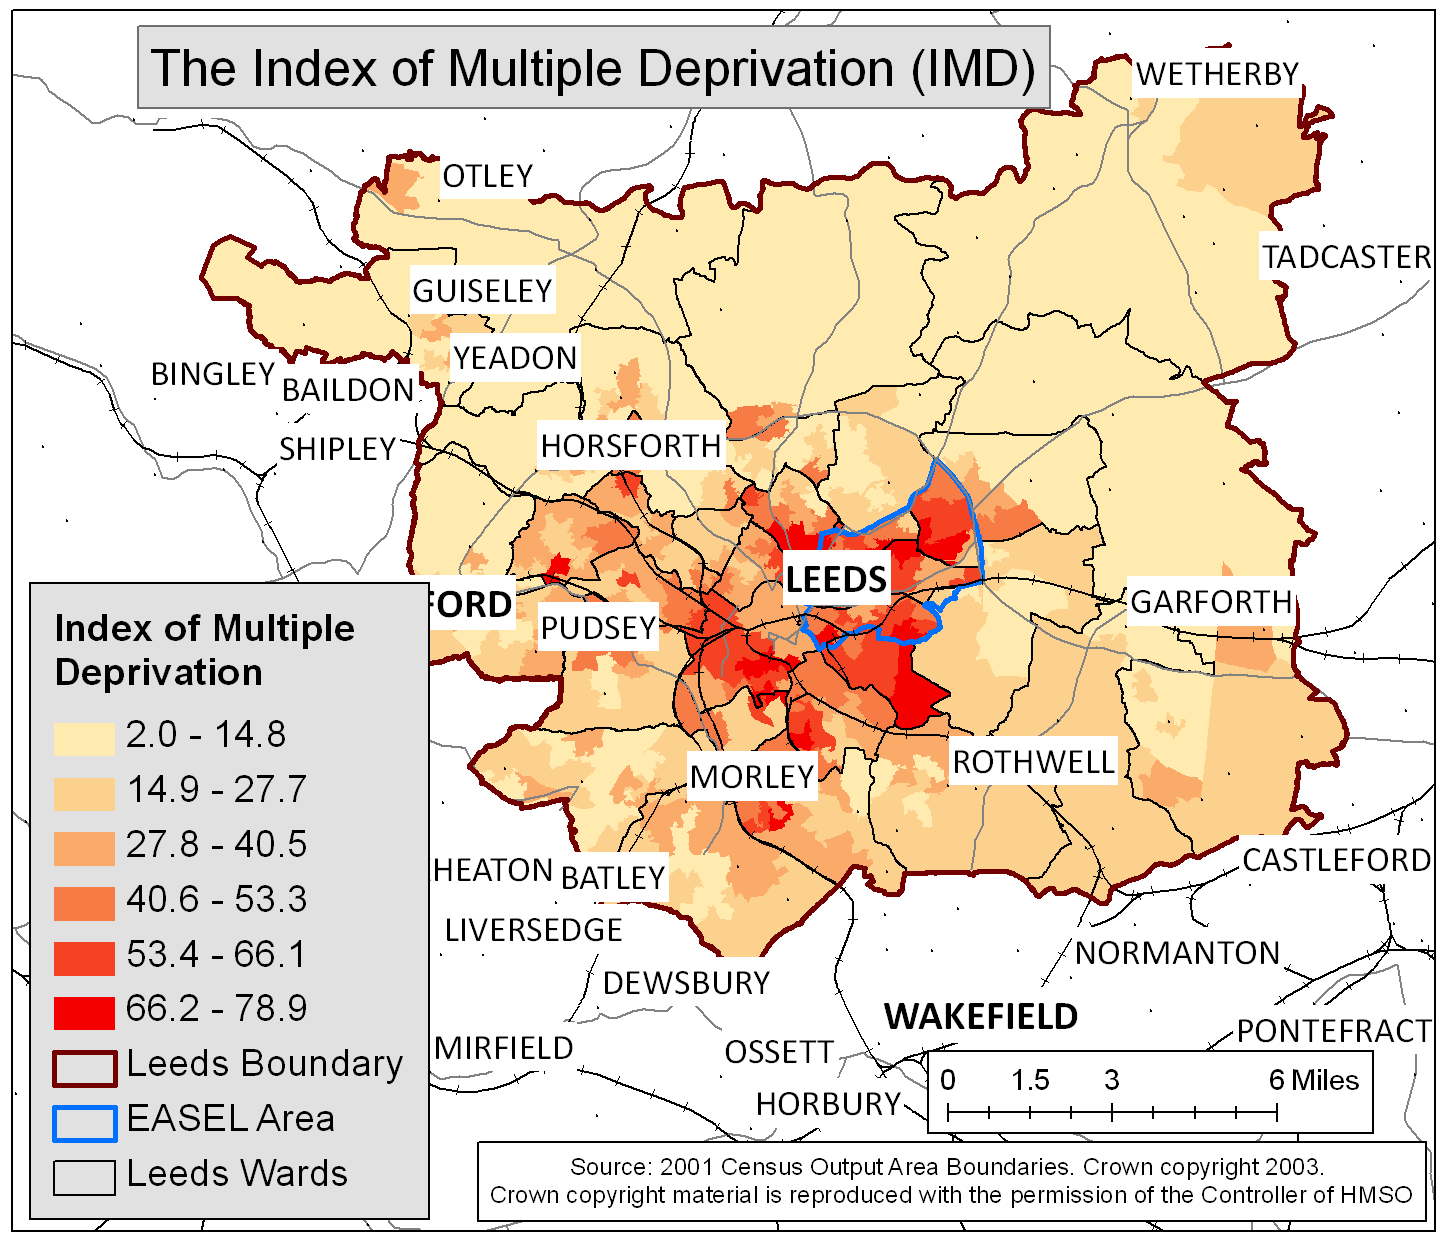
Source: Malleson, N., 2010. Agent-Based Modelling of Burglary. PhD Thesis, School of Geography, University of Leeds, UK.
Rose diagrams
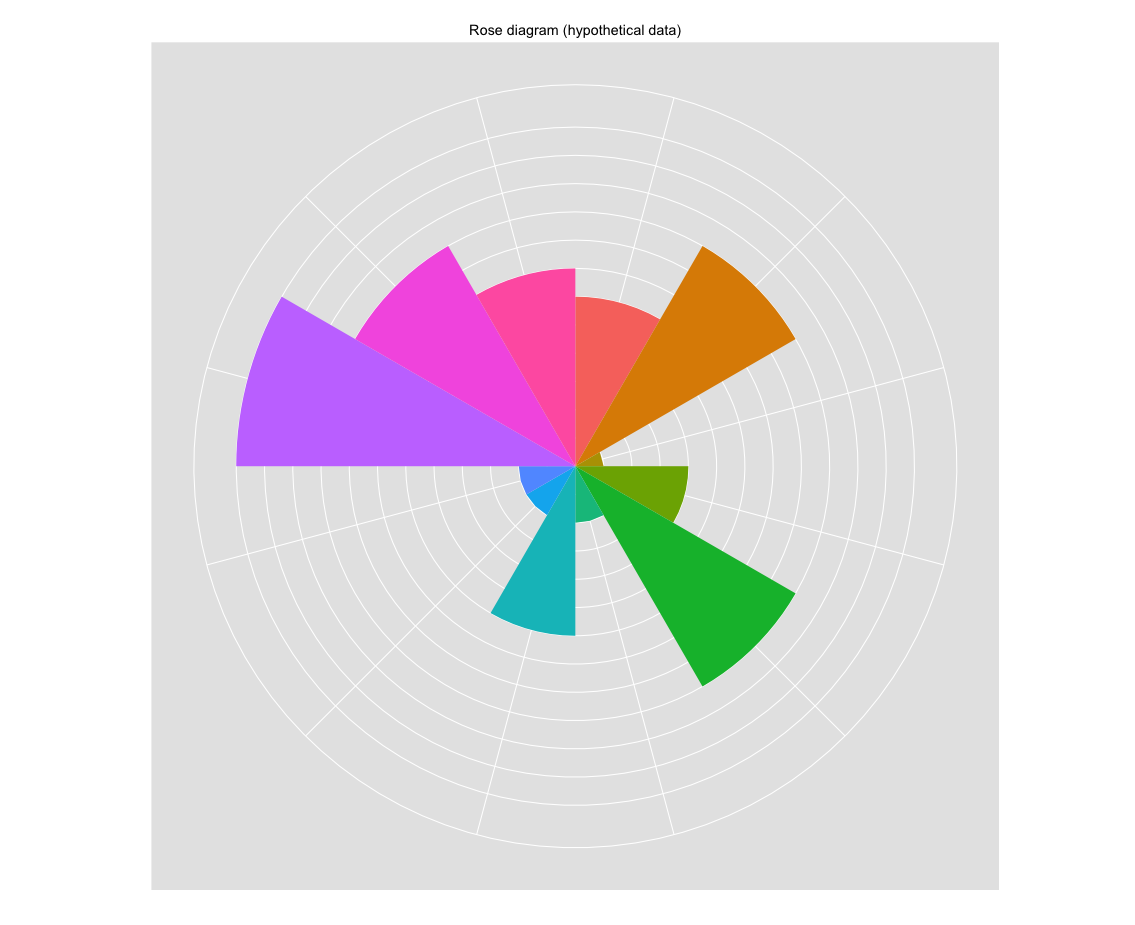
Rose diagrams

Space-time Cube
Phase Maps
Question 3 - Visualising Patterns
List some disadvantages associated with visualising data in order to find patterns and draw conclusions.
Think about this in silence for a few minutes.
Suggestions to: http://www.polleverywhere.com/nickmalleson
Poll
Question 4 - Explanation, understanding and causality
Once patterns are recognised, "understanding" our models involves finding explanations highlighting the mechanisms within the models which give rise to these patterns
Key methods for developing understanding:
Types of relationship (correlation): linear, binomial, poisson
Experimentation: sensitivity testing, "what-if" scenarios
Causality: "find the lady problem" and "drop in the ocean problem"
Identifiability and Equifinality
Question 4 - Explanation, understanding and causality
Two GEOG3150 students work independently to create models of crime in a music festival. The causal mechanisms in the models are extremely different, and yet both models lead to the same result.
What best describes this phenomenon?
1. The "find the lady problem"
2. Equifinality
3. The "drop in the ocean problem"
4. Identifiability
Think about this in silence for a few minutes.
Poll
Discussion
The phenomena in which two very different models lead to the same result is know as:
1. The "find the lady problem"
2. Equifinality
3. The "drop in the ocean problem"
4. Identifiability
Discuss the answer with your neighbour(s) for a few minutes. Which is the right answer? Is there a right answer?
Poll again
Question 4 - Explanation
Identifiability
"a single model outcome may have more than one history of model parameters that leads to it"
i.e. one model, but lots of different parameter values can lead to the same results
Equifinality
"the model in the computer accurately reflects the system in the real world"
i.e. lots of different models could produce the same results.
The "find the lady problem"
The sheer number of interactions in a model make tracking causality extremely hard
The "drop in the ocean problem"
Often numbers are used to represent aggregated quantities (e.g. 2 children)
This makes it impossible to track a individual through the system
Sometimes this doesn't matter (e.g. drops of water in a lake), but sometimes it does (e.g. ??)
Summary
Causality and Emergence
Recognising Patterns with Statistics
Visualising Patterns
Explanation, understanding and causality
Next
Rrevision & module roundup
http://www.geog.leeds.ac.uk/courses/level3/geog3150/lectures/revision/