Risk Terrain Modelling
Dr Nick Malleson
Risk Terrain Modelling - Overview

GIS techniques to explore the relationship between crime and spatial factors that influence it. E.g.
Public transport
Drug dealers
Schools
Gangs
Parks
Shops
...
Theoretically / empirically informed
Can be used to make predictions
Example: Children cluster
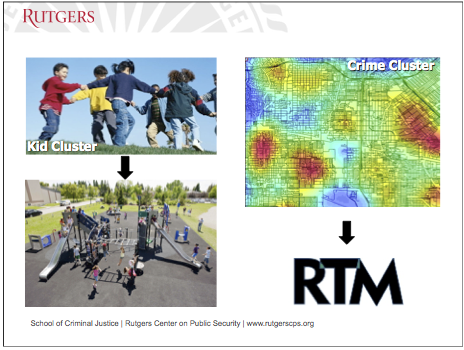
Source: RTM introduction webinar
About The Authors
Methods and software developed by the Rutgers Centre on Public Security
Documentation on the website
RTM software
Free for education
Additional features in the enterprise version
Caplan, J.M., Kennedy, L.W., 2010. Risk Terrain Modelling Manual. Rutgers Centre on Public Security, Newark, NJ.
Main Principles
Crime risk is associated with geography
Spatial factors increase/decrease the risk
BUT: relationship between risk factors and geography is non-trivial
Different configurations of risk factors will determine overall risk
"Drawing from an example in meteorology, individual factors that are incorporated into weather forecasting do not necessarily produce rain, thunder storms or hurricanes by themselves. It is only when they intersect in space and time that they have the greatest potential to yield a particular outcome, e.g. a storm. Other times, only one or a few factors may be required to interact in the same geography and at certain times for a particular event to occur." (Caplan and Kennedy, 2010).
The Process
Identify risk factors to test
Theoretically informed
Empirically informed
Decide on their type of influence
density
proximity
And the extent of their spatial influence
Use the RTM software to create a regression model
Crime = α + β Factor1 + β Factor2 + ...
Numerous models are created / tested and the optimal one is returned
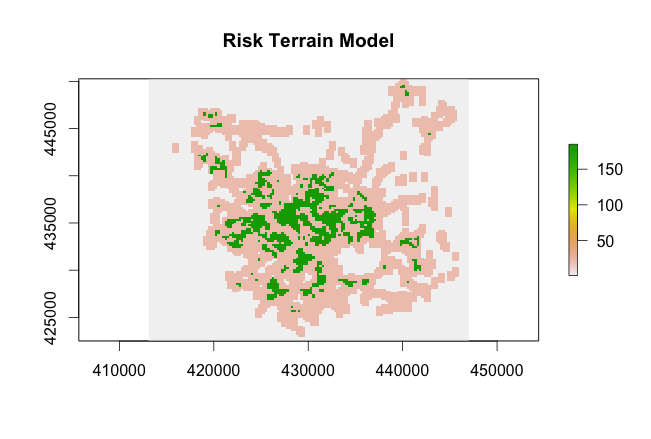
Use statistical / GIS software to generate a risk surface
RTM Example: Burglary
Inputs:
Crime incidence data (dependent variable).
Detached houses
Bus Stops
Output:
A model, and a risk surface
Exp(-3.3565 + 3.0617 * "bus stops" + 2.1578 * "det points") / Exp(-3.3565)