


Section 1.1 introduces artificial neural networks. Section
1.2 describes a neural network modelling exercise designed to create
1 decimal-minute (1 DM) resolution population density surfaces for the
Mediterranean region of the EU. Section
1.3 describes the development of socio-economic surfaces for modelling
land use and land degradation patterns.
1.1.
An introduction to neural networks
Artificial neural networks (NN) are biologically
inspired artificial intelligence (AI) technology which have been designed
based on research into the workings of animal nervous systems. Much
research in the field of AI has demonstrated the powerful
pattern recognition and generalisation properties of NN that make them
capable of learning to represent complex data patterns. NN are comprised
of multiple simple units called neurons which are arranged or networked
in some way that enables them to perform transformations on (and classify)
specific input data. The classification of a set of data records
and the nature of any NN model developed depends on; the characteristics
of the individual networked neurons, the type and configuration of network,
the values of all the NN internal parameters derived during training, other
characteristics of the training process, and most importantly, the nature
of the input data itself. Most NN `learn' to classify (represent
or model) a set of training data through a process of learning by example,
alternatively called supervised training. This typically involves
presenting the network iteratively with an input set of training values
for which the output class is already known. The NN `learns' by modifying
the values of its internal parameters to improve the fit between the observed
output class that is known and the expected output class which has been
derived by the NN from the input values. In training to classify
or represent the patterns and interactions between the input variables
for a given set of training data, the internal parameters of a NN are modified
iteratively by small amounts to improve the fit or performance under some
training scheme (performance or fitness measure). Once the NN parameters
have converged (or training has been halted prior to convergence), the
NN classifier or model can be validated by testing whether it can correctly
classify or estimate the output for a set of previously `unseen' input
values (alternatively known as validation data set) for which the output
class or value is known. NN are capable of representing almost
any non-linear non-continuous complex functional mapping in this way, they
can perform conventional statistical transformations and they can
be applied to represent and model most geographical processes provided
sufficient data is available.
NN can thus be described as universal approximators
capable of searching for the optimal solution in the entire solution space.
However, searching the entire solution space can be very time consuming
and there are ways by which NN can compromise and focus the search to significantly
speed it up. Training parameters help control the degree of focussing
at different stages during training, these can be thought of as heuristics
controls. For some problems it is better to focus quickly at the
start to converge on a solution, but it really all depends on the problem.
Often it can help to introducing small amounts of random noise to the model
paramerters during training to help prevent the networks converging at
sub-optimal solutions (local maxima or minima). Randomly initialising
NN using different random seeds and comparing the parameter values of the
trained networks can provide useful information about the generality and
complexity of the problem being investigated.
To briefly summarise, NN are generic pattern recognition
technology and can be applied to classify or model virtually anything provided
there is enough data, they are robust, resistant to noise and can learn
to represent and generalise complex non-linear non-continuous mappings.
The image below is a representation of a simple artificial neuron.
This neuron operates by multiplying its inputs ( )
by their respective weights (
)
by their respective weights ( )
to send an output signal (
)
to send an output signal ( )
having applied some function (
)
having applied some function ( )
to the difference between the sum of the weighted inputs and some threshold
value (
)
to the difference between the sum of the weighted inputs and some threshold
value ( ).
).
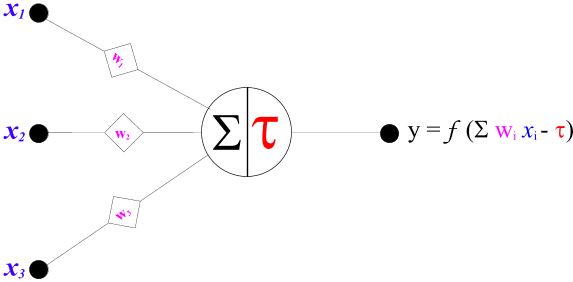 Biological neurons are more complex, have many curious special properties,
and generally have thousands of interconnecting inputs and outputs.
Nonetheless, at the neuron level, biological neurons effectively function
like the artificial neuron shown above. It is the ability to perform
weighted summation type decisions that is believed by many to be the key
to humans being able to evaluate complex situations quickly, although it
is the adaptive learning characteristics of the network which is generally
responsible for endowing us with intelligence. An individual artificial
neuron only has a pattern recognition capability equivallent to the complexity
of the function ().
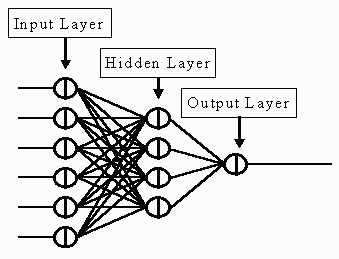
The real power of neurocomputing comes from assembling these simple components
into network structures like the simple 6x4x1 network represented in the
image below.
Biological neurons are more complex, have many curious special properties,
and generally have thousands of interconnecting inputs and outputs.
Nonetheless, at the neuron level, biological neurons effectively function
like the artificial neuron shown above. It is the ability to perform
weighted summation type decisions that is believed by many to be the key
to humans being able to evaluate complex situations quickly, although it
is the adaptive learning characteristics of the network which is generally
responsible for endowing us with intelligence. An individual artificial
neuron only has a pattern recognition capability equivallent to the complexity
of the function ().
The real power of neurocomputing comes from assembling these simple components
into network structures like the simple 6x4x1 network represented in the
image below.
 In general, the more complex the network is, the more powerful it is in
terms of recognising unique situations and modelling interactions.
However, the more complex a NN is, the longer it takes to train since complex
networks have more internal parameters to modify and optimise. The
larger the number of internal parameters, the greater the likelihood is
that the NN will begin to recognise individual cases. Often it is
the general patterns that are of greatest interest in which case it is
undersirable to use a very complex network configuration that effectively
wraps itself around the training data in an overly unique fashion.
It is therefore very important to attempt to use as few parameters as possible
(as simple networks as possible) if the aim is to make a generalised model
rather than an accurate classifier. For nearly all NN modelling exercises
extensive experiments are necessary develop an appropriate training scheme
and compromise between the complexity of the network, the complexity of
the modelling task and the levels of accuracy and generality required.
To create a more general continuous classifier it is (as mentioned above)
sometimes worth adding random noise to the input data in the later stages
of training.
In general, the more complex the network is, the more powerful it is in
terms of recognising unique situations and modelling interactions.
However, the more complex a NN is, the longer it takes to train since complex
networks have more internal parameters to modify and optimise. The
larger the number of internal parameters, the greater the likelihood is
that the NN will begin to recognise individual cases. Often it is
the general patterns that are of greatest interest in which case it is
undersirable to use a very complex network configuration that effectively
wraps itself around the training data in an overly unique fashion.
It is therefore very important to attempt to use as few parameters as possible
(as simple networks as possible) if the aim is to make a generalised model
rather than an accurate classifier. For nearly all NN modelling exercises
extensive experiments are necessary develop an appropriate training scheme
and compromise between the complexity of the network, the complexity of
the modelling task and the levels of accuracy and generality required.
To create a more general continuous classifier it is (as mentioned above)
sometimes worth adding random noise to the input data in the later stages
of training.
Data pre-processing is important to develop a feel for the available
data and investigate ways of transforming and combining these data into
more useful inputs. Experience, common sense and some general rules
of thumb can help in selecting an appropriate NN configuration to model
a geographical-environmental (or geoenvironmental) process, however, there
is no recognised standard method of achieving a compromise or optimising
the parametrisation prior to extensive experimentation. Further post-processing,
testing and validation is crucial and helps demonstrate whether a sufficiently
accurate and general classification has been generated.
There are several different types of NN and a great many different ways
to train them to recognise complex non-linear patterns which map a set
of inputs onto a set of outputs. The best training scheme to employ
depends as much on the nature (configuration, structure and other properties)
of the network as it does on the pattern recognition task itself.
Four types of NN commonly used in research are; the multilayer perceptron
(MP), the radial basis function net (RBFN), the learning vector quantisation
network (LVQ), and the self organising map or Kohonen network (SOM).
Probably the simplest and easiest to understand are
back propogating feedforward multi-layer perceptrons (BPFMP). These
feed inputs in at one end, process in one direction from layer to layer
to produce an output at the other end. The BPFMP represented in the
image above has 6 neurons in its input layer, a
single neuron in its output layer and 4 in a hidden layer inbetween.
BPFMP are supervised NN, where the training process involves comparing
the expected output value derived by the network from the input data with
an observed value provided by a sample (or training) data set. Training
involves iteratively reducing the difference between observed and expected
values by adjusting the parameters of the network (weights, threshold values
and those of the specific function ()
which is used to generate neuron outputs) by a small amount working backwards
from the output layer towards the input layer. Supervised training
often uses training pairs which are repeatedly presented to the network
a number of times (often controlled by the rate of change of the network
parameters) prior to the next training pair. RBFN and LVQ
networks also trained using a supervised method, but SOM are different
and perform unsupervised classification where the neurons compete to represent
each training case. Unsupervised classification is a powerful way
of classifying data into a number of distinct classes or data defined dichotomous
sets, where the members of the same class are similar and the classes are
all very different. SOM can be used for prediction purposes but this
is rare, usually when they are used they form part of pre-processing to
reduce the number of input variables to simplify the supervised NN prediction.
Once NN have been trained to recognise or classify
patterns relating values of a `dependent' spatial variable with values
of other `independent' spatial variables, they can be used to predict values
of the dependent variable in new areas. These predictions can be
at a more detailed spatial resolution (spatial interpolation), they can
be beyond the present spatial extent of the dependent variable (in effect
a spatial extrapolation) and they can fill in gaps of missing data in the
variable surface. In general, NN are better at interpolating than
they are at extrapolating. In a spatial data classification context
there are at least two senses to the terms extrapolation and interpolation,
one is spatial as described above and another relates to the input values
of the spatial variables. (A similar confusion may arise in
the temporal domain when predicting and forecasting time series data patterns.)
In geography spatial interpolation and extrapolation get further confused
at a global synoptic scale due to the continuous properties of the surface.
A fairly important thing to be aware of when applying a trained NN model
is that a if it is presented with input values which lie outside the range
of values in the training data it is more likely to classify wrongly than
if all the input values lie well within and close to others in the training
data set. The interpolating and extrapolating
capabilities are most severely constrained by the availability and quality
of independent variable data. Uncertainty issues abound.
Expressions of the uncertainty in NN predictions
can be developed based on; measures of the similarity between the combination
of spatial variable data values and their relative location with respect
to the data used in training, the fit of the trained model, input data
and modelling errors, and other information about the dichotomy of the
training and validation data sets. In the context of developing the
Synoptic Prediction System for MEDALUS
III it was appropriate to attempt to develop models with relatively
even levels of spatial bias and uncertainty. Initially the most important
thing was to find an appropriate way to select training and validation
data sets. The aim is to dichotomise and proportionally represent
the range of area typologies in terms of both location and combinations
of input variable values.
In summary, NN are universal approximators capable of learning to represent
spatial interactions. Despite the major advantages of using NN to
model complex processes there are various difficulties which need to be
recognised, in particular; as yet there is no easy convenient means to
communicate with the model, the selection of network type and architecture
is somewhat subjective, NN are computationally intensive, and they require
a great deal of effort to experiment with and use effectively for a specific
application. However, NN are robust, non-linear, resistant to noise
and can be used to appropriately compromise generality and accuracy and
probably offer the best levels of performance for the major complex system
modelling tasks addressed in this project. The next section describes
experiments which used NN to interpolate population density across the
EU.


1.2.
Interpolating population density
The disaggregative spatial interpolation problem (DSIP) concerns how best
to transform spatial variable values for a specific source geography into
values for a different target geography which has a much higher general
level of spatial resolution. The DSIP is a distinct variant of the
cross-area estimation or spatial interpolation problem due to the massive
disparity between the size of the source and target geographies.
DSIPs are common in environmental change research where a major hindrance
has been the absence of socio-economic data at a level of spatial detail
suitable to be linked with outputs from other physical-climatic based environmental
models. Click here for a working paper which
reviews existing areal interpolation methods and reports experiments to
compare these with more objective intelligent interpolation methods (IIM)
which employ NN.
This section reports an exercise designed to create EU population density
surfaces at a 1 decimal-minute (1 DM) level of spatial resolution by interpolating
NUTS3 resolution population data from EUROSTAT.
NUTS3 socio-economic data zones are irregular in shape and vary in size
considerably but are approximately 3,000 km square on average. The
aim of this exercise was to train NN to find patterns between a wide range
of geographical variables believed to be related to population density
and population density estimates from available high resolution census
data then apply the trained NN to interpolate population density for NUTS3
regions in the Mediterranean region of the EU. High resolution census
estimates were only available for the UK, so although it was undesirable,
it was necessary to generate the resulting EU population density surface
based entirely on patterns between the variables in the UK. The assumption
was that, although the settlement patterns in the UK are different to those
in other regions of the EU, the general patterns represented in the training
data would be sufficiently representative so as to produce realistic relatively
accurate estimates for the Mediterranean region of the EU. We hoped
that producing some population density estimates at a high level of spatial
resolution would encourage higher resolution socio-economic data to be
made available for EU countries in the Mediterranean climate region.
With this data the models could be retrained and retested to hopefully
improve the results.
Section 1.2.1 below provides links to information about the data sources
that have been used. Section
1.2.2 describes some of the GIS pre-processing involved in creating
the NN inputs. Sections 1.2.3 to 1.2.6
describe an experiment designed to improve the resulting population surfaces
using an iterative modelling approach. Each section provides links
to maps and descriptions of the data inputs used in the modelling, descriptions
of the training and validation schemes employed and some comments and ideas
for further improvements.
1.2.1. Data
sources
Most of the links in the below list are to other internet sites so you
may like to bookmark this page so you can find your way back easily.
1.2.2. GIS
Preprocessing
All the source data used in this project was compressed and archived in
its source format along with any available relevant information about the
data. The data was investigated, queried and mapped using ESRI
ArcInfo and ArcView Geographical Information Systems (GIS) sofware.
These are proprietary systems that provide the basic functionality (building
blocks) required in order to develop relatively advanced exploratory spatial
data analysis (ESDA) tools. ArcView has a menu driven Graphical User
Interface (GUI) with which it is easy to map and visualise geographical
information. ArcInfo is driven from the command line, has slightly
more extensive spatial analysis functionality, and has a very useful macro
programming language (AML) which has been used to automate many of the
GIS processing tasks involved in this project.
All the source data was imported into ArcInfo and stored either as a
square raster grid or an arc coverage, the import procedure was summarised
and this information was archived with the original source data.
The data was then mapped using ArcView, queried and investigated by panning
and zooming around and selecting various sets of data records. The
grids and coverages which were believed to be too inconsistant or incomplete
to be useful were deleted. The source data was then projected into
a geographical latitude-longitude projection using various often convoluted
procedures. The projected data was again mapped and after further
investigations those data layers considered most useful were selected to
be used. These layers were either directly converted into a single
NN input in the chosen 1 DM spatial framework, or were geographically generalised
(geogeneralised) to provide surfaces of location, distance or density (no
direction or orientation layers like slope aspect were used here).
Subsequent combination and further geogeneralisation was then considered
to create potentially even more useful information layers. After
yet further mapping a number of surfaces were selected and converted into
an ascii format to be read into the NN fortran programs. Details
of the GIS work involved in transforming the various source data into NN
inputs are provided along with maps of the data below.
1.2.3. Model
1
1.2.3.1.
Description
For each cell in the 1 DM spatial framework the values of each variable
were concatenated into a large file from which a training data set was
randomly selected. Click here
for a map showing the locations of the training data cells. A sigmoidal
function was used to calculate each neuron output and each network configuration
was initialised using a genetic optimiser. The genetic optimisation
procedure involves firstly randomly assigning values to the weights and
thresholds of the network a predefined number of times. Each set
of parameters is then encoded as a bit string (a catenated binary representation
of the NN parameter values). Then, for each set of weights the performance
of the NN model was measured by passing the training data through the classifier
and calculating the sum of squared errors between the expected output and
the target value. A number of the best performing sets of weights
were then selected to be parents and their bit string representations bred
using the genetic operations of crossover, inversion and mutation to produce
a number of children. The bit string representations of these children
were then translated back into NN parameters values and the genetic optimisation
process of evaluating, selecting and breeding was repeated a predefined
number of times. When genetic optimisation was completed the best
set of weights was used to initialise the network for further training
using a standard conjugate non-linear optimisation method as described
above. (The number of
iterations through the genetic optimiser had little, if any, effect on
the final network parameters. Genetic optimisation was simply used as an
efficient means of giving the NN a head start to reduce the overall training
time required. In this case the genetic optimisation initialised
the parent bit string parameters randomly, however the initialisation could
have been more regular, for example it could have used mean values of SOM
classes. An advantage of a regular initialisation over a random one
is that prior to focussing the search somewhat of a general picture there
is greater control and a greater likelihood of searching the entire solution
space in a general fashion before focussing the search.) At various
stages prior to convergence training was halted to check the progress of
the model. When the internal parameters of the network converged indicating
that further training would not significantly improve performance training
was halted. After training the entire dataset was transformed to generate
a population density surface for the EU which was subsequently mapped and
the errors were analysed for the UK and Italy.
1.2.3.2.
Inputs
ArcInfo and ArcView were used to manipulate the source data into 1DM resolution
grids whose values reflect the density, distance from and location of geographical
features or other spatial variables. The data layers used are listed below,
follow the links to maps and descriptions of the data:
1.2.3.3.
Outputs
Four different NN configurations were trained, two were simple one layer
networks with 25 and 50 neurons in their hidden layers and two were more
complex networks with two hidden layers each with either 10 or 20 neurons
in them. For all four configurations the predictions were constrained using
the NUTS3 resolution population estimates from EUROSTAT.
For the simple one layer networks predictions were also constrained using
the small area statistics (SAS) population estimates at ward level for
England and Wales and synthetic
registration zone population estimates for Italy. Errors at ward level
in England and Wales and for the synthetic registration zones in Italy
were analysed for these simple network outputs. Click the below list to
view maps of the resulting population surfaces and their estimated error.
1.2.3.4.
Comments
-
Measurements of error are based on the difference between the population
estimates from the model and other estimates of population from census
data.
-
Higher spatial resolution constraints reduce error at the 1 DM resolution
in England and Wales.
-
It would be useful if the EU provided some mechanism to disseminate NUTS5
resolution socio-economic data for this type of research. These data are
known to exist in national statistical offices but only data for Great
Britain and Northern Ireland was made available at this resolution with
the relavant digital boundary information. ISTAT the Italian national statistical
office did permit use of centroid based population estimates from which
the boundaries of NUTS5 regions were estimated but the accuracy of this
procedure was unknown. As yet no further data has been forthcoming.
-
Negative population predictions occurred in all of the output surfaces
necessitating further post-processing to remove them. The negative predictions
tended to occur where at least one independent variable value was outside
the range of values in the training data. At this stage negative predictions
were simply set to zero. A better option employed in subsequent models
was to rescale the predictions in a more consistent way using the NUTS3
constraining data.
-
Stratifying the selection of training data cells might improve the results,
especially in urban areas where the predictions were overly smooth. The
reasoning being that perhaps the selection of densely populated cells in
the training data was disproportionately small and did not account for
the variation in the other inputs.
-
The 23x10x10x1 network produced the best output which was used as an input
for the first synoptic land-use classification described in task
2.
1.2.4. Model
2
1.2.4.1.
Description
As in Model 1 sigmoidal functions were employed to
compute neuron outputs and the genetic optimisation procedure was used
to initialise the neural network parameters. Some of the inputs considered
most useful from Model 1 were again input and several new input layers
were also created. RIVM's population density surface, Tobler's pychnophylactic
population density surface and the night-time lights data were not input
so that the results surface was based on more generally available digital
map based information. The location layers of built up areas containing
different sized town centres were not input. The major reason was because
much of this information was believed to be accounted for in the location,
distance and density layers of built up areas and different sized towns.
The location of all national and regional parks was input as a single layer
instead of just the location of national parks.
At this stage distance and in particular density
layers were believed be a key to solving the disaggregative spatial interpolation
problem. The model inputs selected reflect that and are based more closely
on Central Place Theory
than before. The training dataset was selected by randomly selecting training
data cells of equal number from four population density bands. Transformed
outputs were re-input iteratively to effectively bootstrap the predictions.
The transformations used in the bootstrap included the average of previous
model outputs, a location layer which classed the best model output into
above and below mean population density areas, a smoothed (square rooted)
version of the best model output, and a clumped (squared) version of the
best model output. The average of previous model outputs was used in an
attempt to help the predictions converge. Convergence was observed by analysing
the changing difference between it and the surface generated at the next
iteration. Sometimes a greater weighting was given to the latest output
when calculating the average bootstrap for the next iteration. During training,
as the NN parameters began to change by only a small amount training was
halted and a population surface output was created in the usual way, the
transformed model output variables were then updated, the training data
was recreated and training was restarted with the same parameter values
as when it was stopped. For each NN configuration there were 5 iterations
through this bootstrap loop. A program which measured error in various
ways between predicted and observed populations in Great Britain was used
to evaluate model performance as a quick alternative to mapping the errors
in each case.
1.2.4.2.
Inputs
1.2.4.3.
Outputs
21x10x10x1
21x10x5x1
21x5x5x1
1.2.4.4.
Comments
-
It took considerably less time to train the networks
compared with Model 1. This is partly due to a reduction in the number
of variables and partly a result of using the new bootstrap method.
-
Further experiments with other types of transformed
outputs to bootstrap the results could be useful. It should be possible
also to use fewer variables at any one time by swapping possitively correlated
variable inputs at the same time as updating the bootstrap inputs. Detailed
factoring and combining of variables might also take place at the same
time to converge on a result from a variety of directions.
-
The additional density layers input were a good substitute
for the location layers which in retrospect only provided information about
the functionality of built up urban areas. Although these location layers
helped the NN classifiers converge they were believed to detract from the
real aim of the modelling task.
-
The as the input layers were factored and combined
they became better indicators of population density and it became easier
to understandable how they are combined by the NN to produce the population
surfaces.
-
After validating the model the NN could be retrained
on the entire training and validation dataset for Great Britain prior to
applying the model across Europe. Examining changes in the network parameters
before, during and after this retraining could provide useful information
about aspects of the uncertainty and generality of the model.
Data ownership copywrite and license agreements
severely restricted the dissemination of the resulting EU population surfaces
from Model 1. By not using the night-time lights frequency data, Tobler's
pycnophylactic population density surface or RIVMs population density surface
the results from Model 2 could now be disseminated to other MEDALUS III
colleagues.
1.2.5. Model
3
1.2.5.1.
Description
In this model the number of some of the simple loccation
inputs which were left out the time before were included again as it was
This model uses a greater number inputs which it was hoped contained more
useful information than used in Models 1 and 2. The same training data
stratification procedure as Model 2 was used, and again the neural network
functions and the genetic optimisation were the same as previously. Here
there is no potentially contentious iterative use of transformed model
outputs as in Model 2. Click here to download the AML program which
was used to create the line and area geogeneralised density surfaces.
In this model three seperate networks were used
to generate a single output. One was used to predict zero population density,
another was used to predict medium to low population density and the other
used to predict medium to high population density. Each network was trained
on slightly different inputs all of which were created from public domain
data in order to create an output surface which could be disseminated to
anyone in the public domain. An interactive output map was developed so
that the surface might improve with user feedback. Access to the
interactive output maps has been restricted to medalus only because the
Bartholomews data has been used to provide a spatial reference.
1.2.5.2.
Inputs
1.2.5.3.
Outputs
1.2.5.4.
Comments
1.3.
Developing land use related socio-economic data surfaces
1.3.1.
Estimates of local market demand
Localised population density measurements are directly related to the local
and regional demand for agricultural produce. The relationship of population
density to land degradation is much more complex. Initial experiments As
more data becomes available it may become possible to break down population
by age (and other variables) in a satisfactory way to increase the detail
of the demographic component of the database.
1.3.2.
Distance and accessibility to market
Localised population density measurements are directly related to the local
and regional demand for agricultural produce. The relationship of population
density to land degradation is much more complex. Initial experiments As
more data becomes available it may become possible to break down population
by age (and other variables) in a satisfactory way to increase the detail
of the demographic component of the database.
1.3.3.
Subsidy and set-a-side surfaces
Localised population density measurements are directly related to the local
and regional demand for agricultural produce. The relationship of population
density to land degradation is much more complex. Initial experiments As
more data becomes available it may become possible to break down population
by age (and other variables) in a satisfactory way to increase the detail
of the demographic component of the database.
1.3.4.
Agriculture intensity surface
Localised population density measurements are directly related to the local
and regional demand for agricultural produce. The relationship of population
density to land degradation is much more complex. Initial experiments As
more data becomes available it may become possible to break down population
by age (and other variables) in a satisfactory way to increase the detail
of the demographic component of the database.
1.3.5.
Agricultural classifications Other socio-economic
data surfaces
Pesticide herbicide and chemical application. Localised population density
measurements are directly related to the local and regional demand for
agricultural produce. The relationship of population density to land degradation
is much more complex. Initial experiments As more data becomes available
it may become possible to break down population by age (and other variables)
in a satisfactory way to increase the detail of the demographic component
of the database.
Others
Polution
water quality and provision rock aquifer, river, spring etc....
Land asthetics - tourism.
1.4.
General comments and ideas for improvements
As the understanding of geographical relationships between the available
Further improvements in the surfaces could be made by both reducing
the number of input variables and employing some kind of bootstrap which
might also reduce training times.
As GIS pre-processing becomes more advanced and generates more useful
population indicators from the source data and as modifications in the
training scheme and the selection of more appropriate network configurations
are made based on experiments, the performance of successive models should
improve and result in more realistic population surfaces.
The NN employed so far in this task are feed forward
multilayer perceptrons which classify new areas based on patterns they
have trained to recognise between; measurements and estimates of the variable
of interest (at a relatively coarse resolution), other spatial variables,
and values of the variable of interest at the required resolution. Different
ways of selecting the training data and pre-processing the geographical
information in the available source data have been experimented with. Detailed
uncertainty analysis has been left out due to lack of data quality information
for the inputs and lack of validation data for the Mediterranean region.
Basic uncertainty rules of thumb apply rule to represent of the entire
dataset because it makes sense that; as the location and combination of
spatial variable data values in the predicted surface become more similar
to those of the training data, the degree of uncertainty in the predictions
reduces.
The neural networks predict EU population on the basis of population
patterns in Great Britain. Some regional variation in settlement patterns
across Europe which is not like that in the UK is likely and this is not
currently picked represented in the resulting population surfaces generated.
If other small area population data like the target Surpop data became
available for other areas throughout Europe it could be added to the training
and validation dataset and subsequent neural network models should begin
to represent some of this variation. If the training and validation dataset
were to dichotomises the range of regional settlement patterns throughout
Europe uncertainty in predictions should reduce as the outputs will be
more like interpolations than extrapolations. It maybe possible to suggest
which areas it would be most useful to obtain population data for using
a spatial classifier such as a Kohonen net or self organising map (SOM).
The neural network style classification described above is a generic
geographical modelling technique which can be applied to predict the value
of many spatial variables provided sufficient data is available, a biomass
example is provided below. To do this kind of modelling you need; neural
network software, indicator variables which relate to the spatial variable
you want to model, and target data which is detailed observed counts of
this variable at the resolution you require. It is best if there are several
indicator variables and that they are available for the whole area over
which the predictions are wanted. The target data should be available at
a high resolution and is best if it contains areas which contain values
which dichotomise the range of the indicator variables.
European biomass surfaces could be created using neural networks to
model the patterns between detailed biomass target data measurements in
case study areas, the Normalised Difference Vegitation Index, Photosynthetically
Active Radiation measurements, the Leaf Area Index, potential biomass predictions
from green slime models, other indicators derived from climate, relief,
soil and other landuse/landcover data.
Nuts5 zones (roughly the size of British wards) should be used to constrain
the population predictions as the data exists at Eurostat, the analysis
of errors in England and Wales clearly demonstrates why. Further to this
the finer resolution constraints would make some of the inputs which are
desirable for going from Nuts3 to Nuts5 redundant freeing up space for
others variables. In a way current outputs can be used to generate finer
resolution constraints, but I believe this should be avoided until it is
necessary.
Transforming outputs and using them as inputs to successive models should
prove extremely useful. It'll act as a kind of bootstrap should dramatically
improve the results and/or reduce neural network training times significantly.
I hope to generate more information regarding the uncertainty in the
population predictions.
Anyone who thinks they have data that might be useful please email
me and maybe we can strike a deal.
Any MEDALUS III project members who want any of the population outputs
please email me to arrange
the transfer.
It was hope that ground truthing tests for the surfaces that were created
could be done in the case study areas and that colleagues in case study
areas could browse all the inputs to the SPS to estimate the errors and
interact?
Other socio-economic data layers need to be created for the SPS. These
include not only the demographics but also things like the level of agricultural
subsidy, the intensity of landuse, local and regional demands for agricultural
produce....and so on....
This page was last modified in June
1999.