
 |
Return to GeoComputation 99 Index
David Livingstone1 and Jonathan Raper2
1Department of Geography, University of Portsmouth, PO1 3HE United Kingdom
E-Mail: david.livingstone@port.ac.uk
2Department of Information Science, City University, EC1V 0HB United Kingdom
E-Mail: raper@soi.city.ac.uk
The SEDSIM computer model was developed at Stanford University (Lee and Harbaugh 1992, Tzetlaff and Harbaugh 1989) to simulate the erosion, transport and deposition of clastic sediments in three dimensions over geologic time. It has been used to simulate sedimentation produced by meandering rivers, braided streams, alluvial fans, submarine fans and deltas. SEDSIM was originally developed to simulate unidirectional unsteady flow, but has since been modified by the addition of the WAVE module (Martinez 1987,1992; Martinez and Harbaugh 1993), which simulates the development of coastal and nearshore environments affected by wave-induced erosion, transport and deposition. SEDSIM WAVE was developed in the thesis research of Paul Martinez and is owned by Stanford University.
In order to use SEDSIM WAVE for modelling the development of spits, on an event to decadal scale, it was necessary to make modifications to the operation of the model by the alteration of model parameters. This has enabled the application of SEDSIM to spit evolution over engineering spatial and temporal scales without altering its fundamental principles. Thus, the model was run for periods of months and years over a grid of (variously) 500m to 1500m in dimension.
The SEDSIM/WAVE suite of programs (version 3.03) developed by Stanford was written in Fortran 77 and compiled for Silicon Graphics computers running version 4.1 of the operating system Irix. This operating system is now obsolete and the executable code gave problems when used on later generation Silicon Graphics machines. The visualisation procedures developed for Sedsim 3.03 i.e. Sedview (for viewing experiment output) and Visual Sedsim (for viewing interactive experiment runs) (Pflug, Klein, Ramshorn et. al.,1992) were written specifically for Irix 4.1 and the Silicon Graphics Graphics Language (GL). A technique was required in which the Sedsim models could be used in conjunction with fieldwork to examine medium term morhpodynamic change of spit features as well as examining conceptual models for generic spit development. Ad. hoc. mechanisms needed to be developed during the course of the project to handle both the surveyed and simulated datasets.
SEDSIM/WAVE operation requires a set of input files detailing model parameters and initial conditions:
After an experiment a number of output files are generated for each model time step including:
Wave orthogonals and angle of incidence
If SEDSIM/WAVE experiments are run in standalone mode the output will be a topography file showing how the input ‘deposit’ file has been redistributed. If the SEDSIM/WAVE experiments are run in ‘continuation’ mode then the modelling starts from the ‘deposit’ topography generated by the named previous experiment. The output will be a topography file showing how the ‘continuation deposit’ file has been redistributed. SEDSIM/WAVE also provides text reports on the ‘mass balance’ of the deposition and erosion data for each simulated time step for which data is requested. The command files that specify the various parameters can have of the order of 100 potential variables that may effect model output either singly or in combination.
It was necessary to perform many cycles of experiments in order to be able to:
As a consequence it was decided that a model management system was required to manage the large number of command, input and output files, along with a basement and ‘deposit’ topography generation system. A model management system called ‘Sedlinks’ (figure a) was constructed using the Microsoft Access database. Using the database it is possible to record the details of each experiment and to generate the required experiment file.
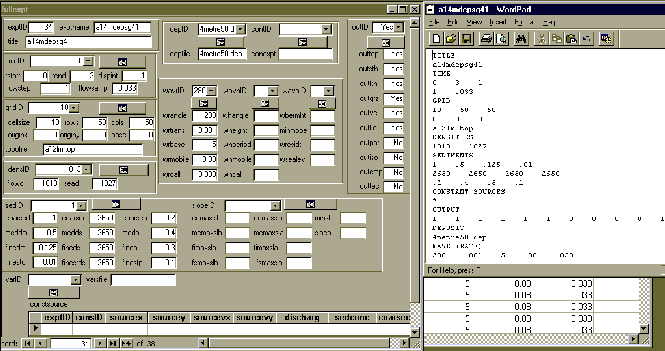
Figure A: Sedlinks - model managment database: Microsoft Access
The 'topography generation' program ‘Sedmodel’ was developed in Arcview GIS using the Avenue programming language. Sedmodel serves 4 purposes:
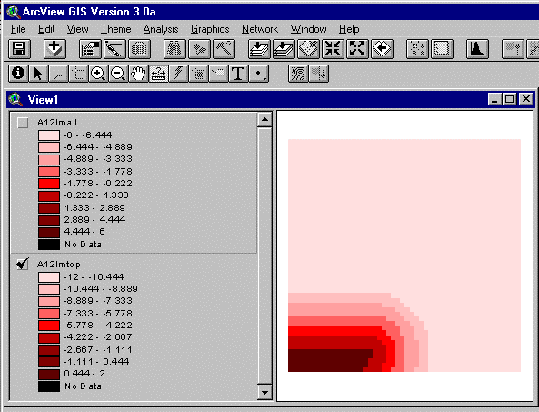
Figure B Sedmodel with hypothetical topography for model experiment
In the topography generation program (Figure B) simple beach topographies for controlled experiments can be created and converted to a format suitable for SEDSIM/WAVE. Sedmodel allows ‘basement’ topographies to be built from user defined polygonal shapes to represent coastline configurations like headlands and bays. The slope angle from the surface of the ‘land above sea level’ can be specified down to a subtidal sea floor. Sedmodel also allows the creation of ‘deposit’ layers of deformable sediment in conformance with the ‘basement’ topography. In these experiments simple topographies have been used to avoid model instability.
Sedmodel is just a series of scripts that can be used alongside normal GIS functions and so it can equally well provide real topographies (Figure C) , perform post model change analysis (Figure D) and compare to the real monitored variations (Figure E).
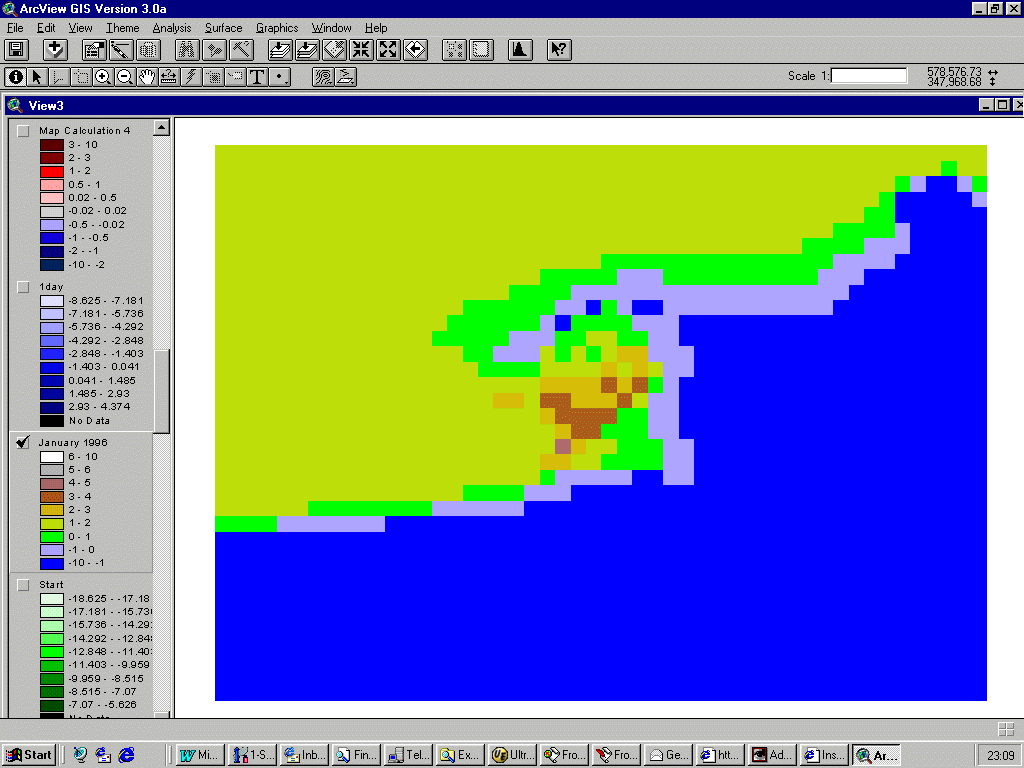
Figure C Sedmodel with real topography for model experiment
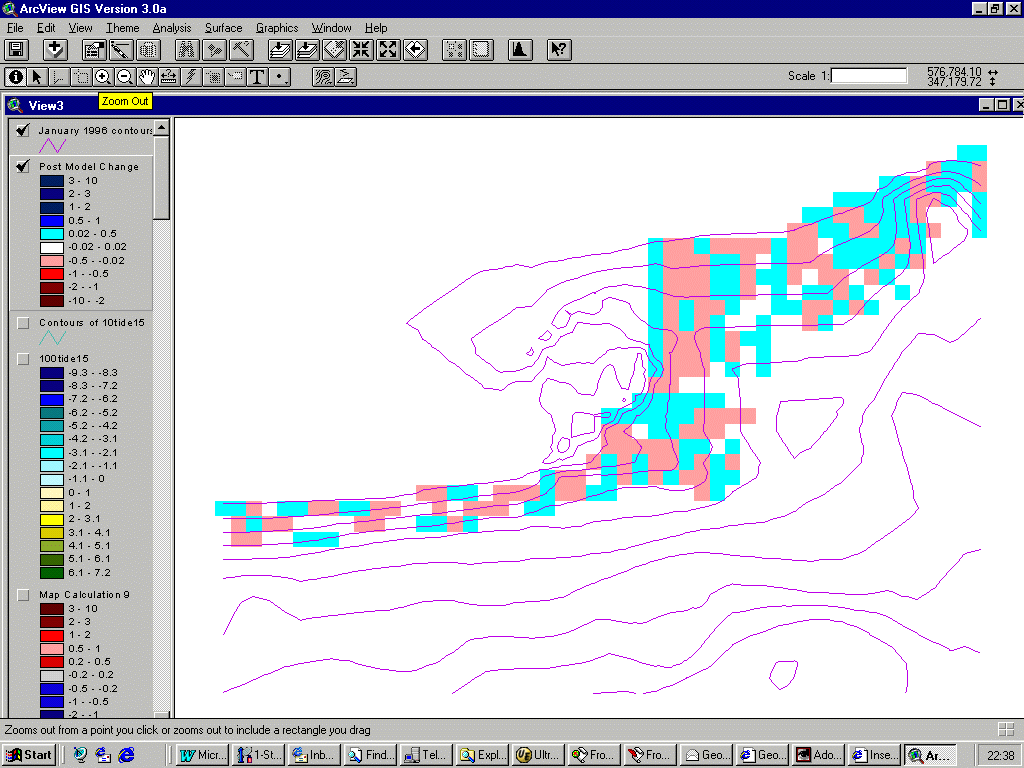
Figure D Sedmodel for comparing post model change
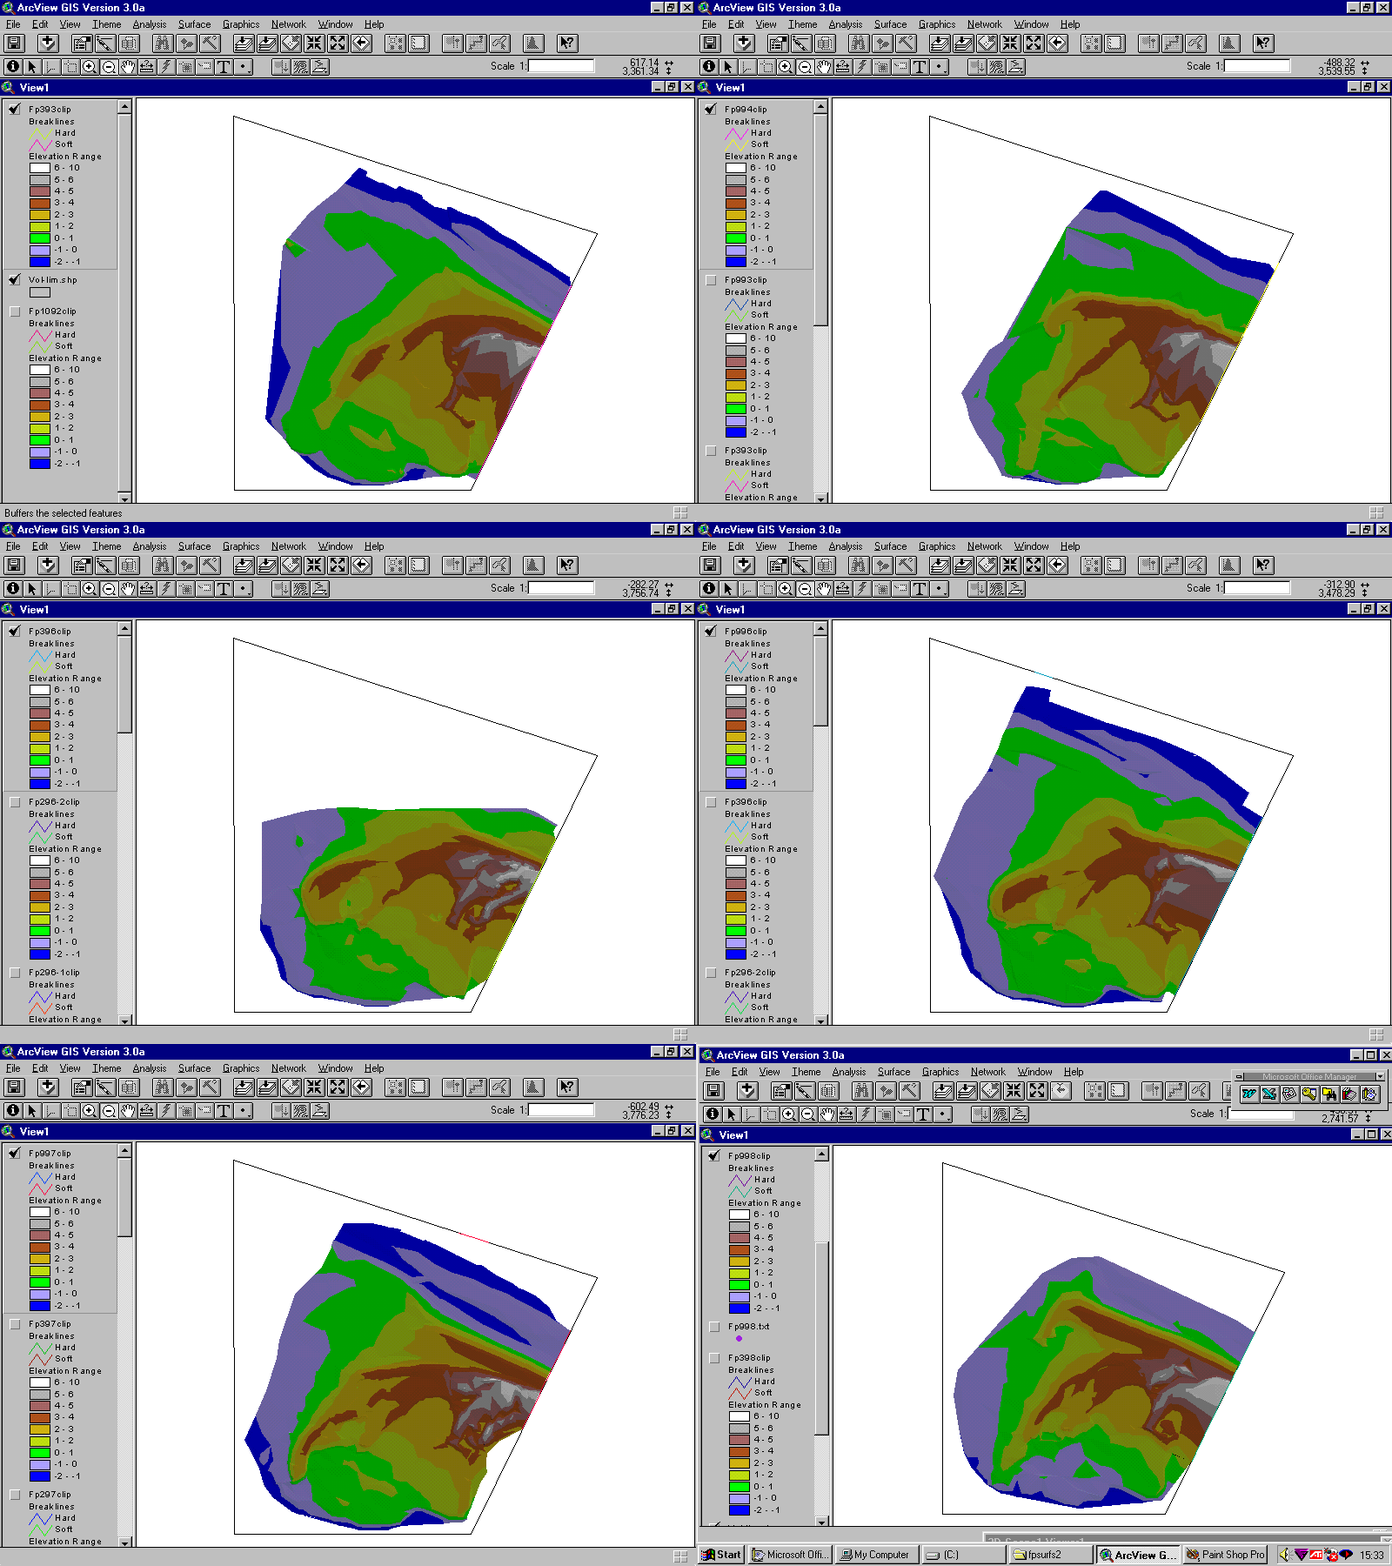
Figure E Real changes to spit observed over 5 years
The overall architecture of the system is shown in Figure F. It can be characterised as a loosely coupled system, not tightly integrated (Fedra,1991. Nyerges,1991) and performed its purpose, but required considerable manual intervention and was very system specific. Therefore it would be of limited use to the coastal modelling community as a whole.
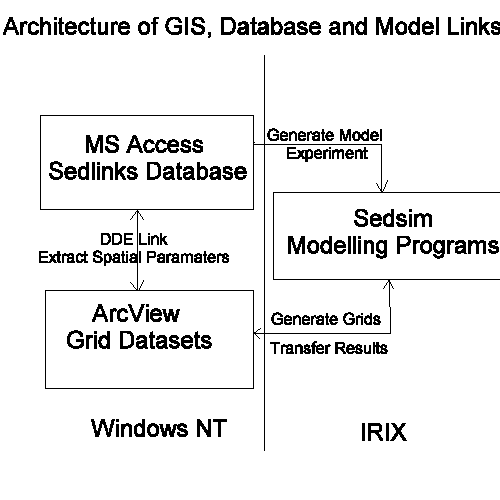
Figure F The architecture used in the initial project and described in the introduction.
New generations of coastal engineers and coastal modellers are using standard Wintel-based systems, the power of these machines is now more than comparable to the Silicon Graphics machines that Sedsim was developed for and, whilst there are organisations that still use UNIX-based environments, there is a convergence of systems that use the range of hardware available. Hence, during the course of the project, it was realised that new approaches were required that could make any simulation model development of potential use to the whole coastal research community. Therefore a new visualisation system based on IDL (the Interactive Display Language) (http://www.rsinc.com/idl/index.cfm)began to be used for this task. This approach has a number of benefits. IDL is a multi-platform system that can also be used for more detailed exploratory data analysis, is widely used for a range of scientific applications and has a flourishing community of developers. It is also more than just a visualisation system and can be used as a general development tool that is ideally suited to array based processing, of the kind that is widely used in environmental simulation (Livingstone and Raper 1994).
IDL was incrementally brought into the project initially for enhanced visualisation but the possibilities that it presented have opened up the possibilities of it being much more pivotal. Indeed it could take over the whole role that GIS played in the project and could even be used to implement the modelling programs. This latter possibility is tempered by the requirement for involvement by the wider community of coastal researchers, the modelling programs are much more accessible if they are in ANSI standard Fortran which is widely and often cheaply available on most, if not all, computing platforms. IDL proved adept at both visualising and generating the hypothetical spit topographies in multiple dimensions (Figure G) and producing multiple plots and difference surfaces (Figure H)
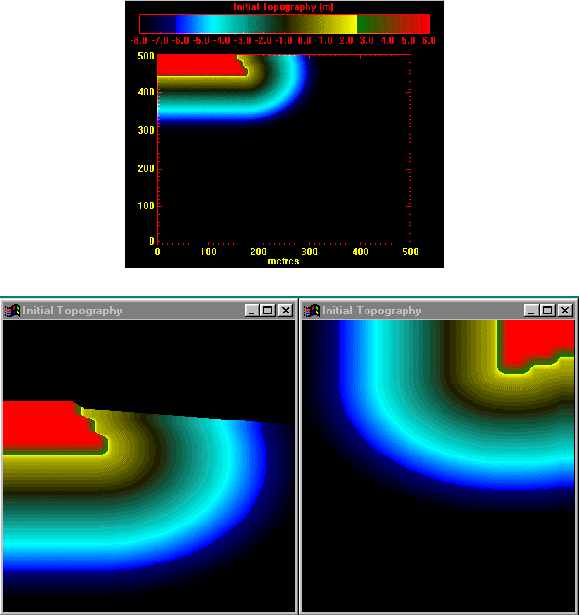
Figure G IDL can visualise in multiple dimensions as well be used to generate topographies
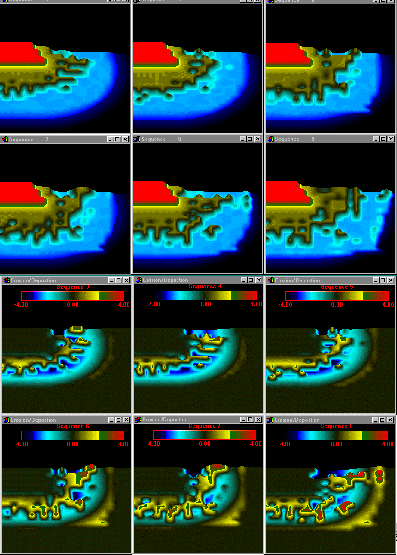
Figure H Multiple plots and change analysis
Dynamic views of the data were also possible (Figure I) and these could be output in animated GIF or MPEG format for web publication or distribution.
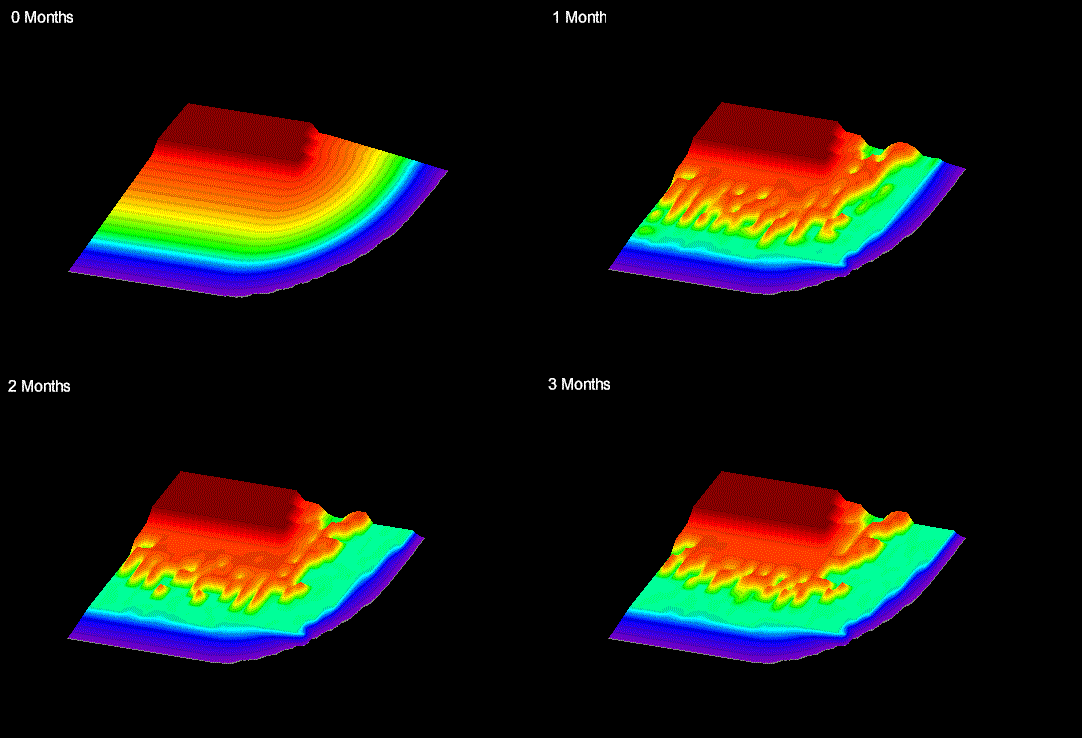
Figure I Animations of model changes
The development environment that is available allows file format conversions that are not directly handled to be relatively easily programmed for both binary and ascii data, especially when the data is in a grid format. The real world data could therefore be imported and compared with model outputs with a much greater range of representations available than in the GIS (Figure J) such as contours, vector fields and grid lines either stacked or in multiple plots. The major drawback over GIS was a lack of native support for geographic transformations, however use of companion software like ENVI or custom routines could certainly handle this problem.
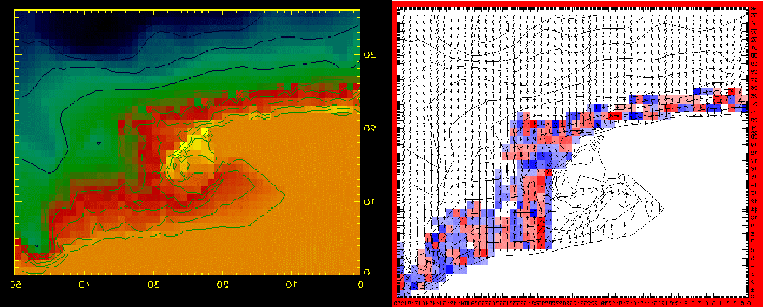
Figure J Real world topography and multiple layered representations
The flexibility of the system for handling grids, both real and hypothetical, has started to pay dividends in the project for bringing together the observed 'top down' data from site specific monitoring and the simulated 'bottom up' data from process modelling (Figure K). GIS is still playing an important part in the project, especially because of its database linkages but the role and scope of the visualisation system is likely to increase.
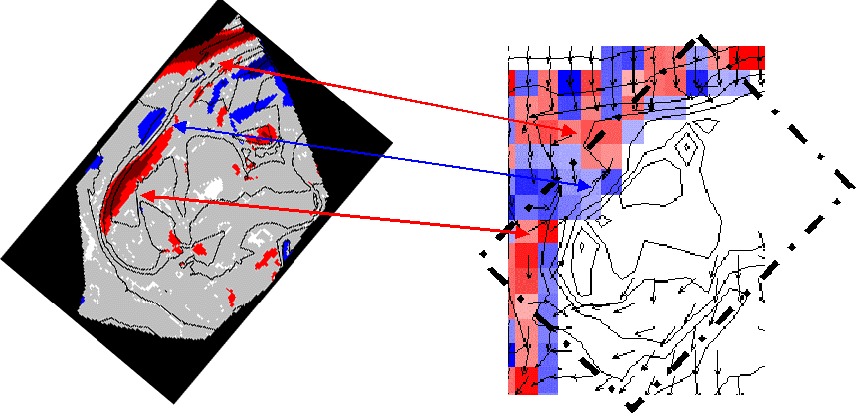
Figure K Enhancing the integration of top-down and bottom-up approaches (Livingstone and Kidd,1999)
The major weakness of the current system is the amount of proprietary data formats that are used and a new architecture is proposed and under development that incorporates the NCSA's Hierarchical Data Format (HDF) ( http://hdf.ncsa.uiuc.edu/ , http://www.hdfinfo.com/). This format is handled either directly by IDL ( http://www.rsinc.com/idl/detail.cfm#data , http://www.dfanning.com/tips/hdf_documentation.html ) or the binaries and source code can be freely obtained from the NCSA ( http://hdf.ncsa.uiuc.edu/obtain.html ) . HDF is a self describing data format that can be used to store multiple data types and structures including raster and vector data, and it is under continual and open development. Its other main advantage is that there are internet data browsers, such as the NCSA's own Scientific Data Server (http://hdf.ncsa.uiuc.edu/horizon/DataServer/sds_design.html) that can browse, view and serve HDF files. The input and output formats that are used by the simulation model can be combined into one or more HDF files the results of which can then be viewed using IDL, but also distributed to co-workers for visualising in the same or different systems. The model management database could then extract information from the HDF file format to allow for more sophisticated query of model runs.
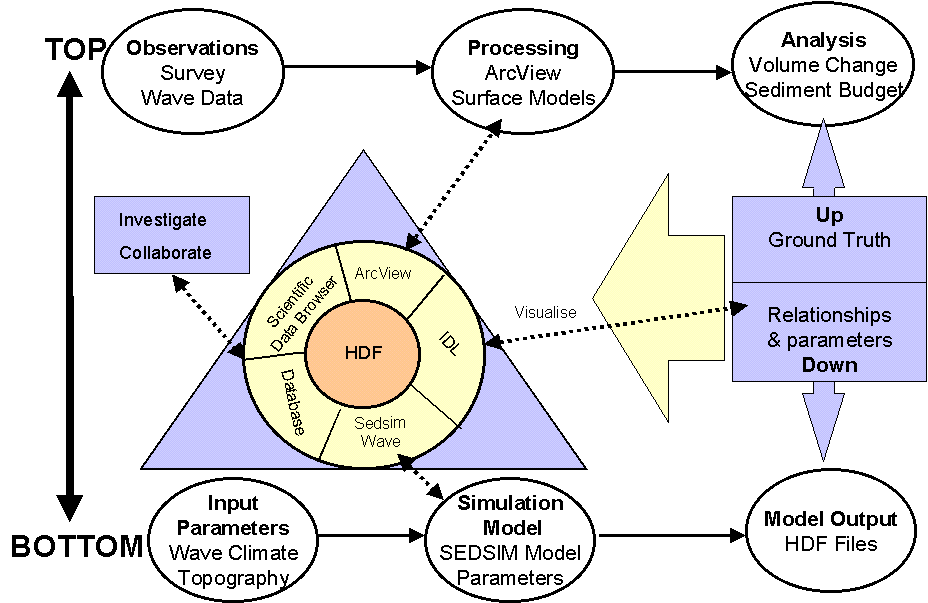
Figure L Conceptual and physical architecture of simulation and visualisation system
The architecture shown in figure L summarises both the conceptual and physical basis behind the proposed system which is currently under construction and attempts to build upon lessons learnt in the development of ad hoc systems throughout the liefetime of the spit modelling project.
Komar, P.D. and Inman, D.L. (1970), Longshore sediment transport on beaches, Journal of Geophysical Research, 75, p5914-5927.
Livingstone, D and Raper, J.F (1994) Modelling dynamic processes in an environmental GIS. Innovations in GIS 1 Ed. Fisher, P. 229 - 240 . Taylor and Francis 1994
Livingstone, D and Kidd D. (1999) ‘Top down’ meets ‘bottom up’: a strategic project to handle the geocomputational requirements of environmental modellers, GISRUK'99, Southampton University, April 1999
Fanning, Dave, Fanning Consulting - 'Better IDL HDF Documentation' http://www.dfanning.com/tips/hdf_documentation.htm
Fedra,K. (1992) GIS and environmental modeling. Proceedings, First International Conference/Workshop on Integrating Geographic Information Systems and Environmental Modeling, Boulder, September 1991.
Fortner Software's HDF Information http://www.hdfinfo.com/
Martinez, P.A. and Harbaugh, J.W. (1993), Simulating Nearshore Environments, In: Computer Methods in the Geosciences, Volume 12, pp265, Pergamon Press, 1993
McGrath, Robert E. ,A Scientific Data Server: The Conceptual Design, National Center for Supercomputing Applications: http://hdf.ncsa.uiuc.edu/horizon/DataServer/sds_design.htm
National Centre for Supercomputer Applications Hierarchical Data Format Home Page: http://hdf.ncsa.uiuc.edu/
National Centre for Supercomputer Applications - Obtaining the HDF Software: http://hdf.ncsa.uiuc.edu/obtain.html
Nyerges, TL (1992) GIS for environmental modelers: an overview. Proceedings, First International Conference/Workshop on Integrating Geographic Information Systems and Environmental Modeling, Boulder, September 1991.
Pflug, R. Klein, H. Ramshorn, CH. Genter, M. and Stark, A. (1992), 3-D Visualisation of Geologic Structures, In: Computer Graphics in Geology, Eds: Pflug, R. and Harbaugh, J.W., Lecture Notes in Earth Sciences 41, p29-39, Springer Verlag 1992
Research Systems Incorporated - Interactive Data Language: http://www.rsinc.com/idl/index.cfm