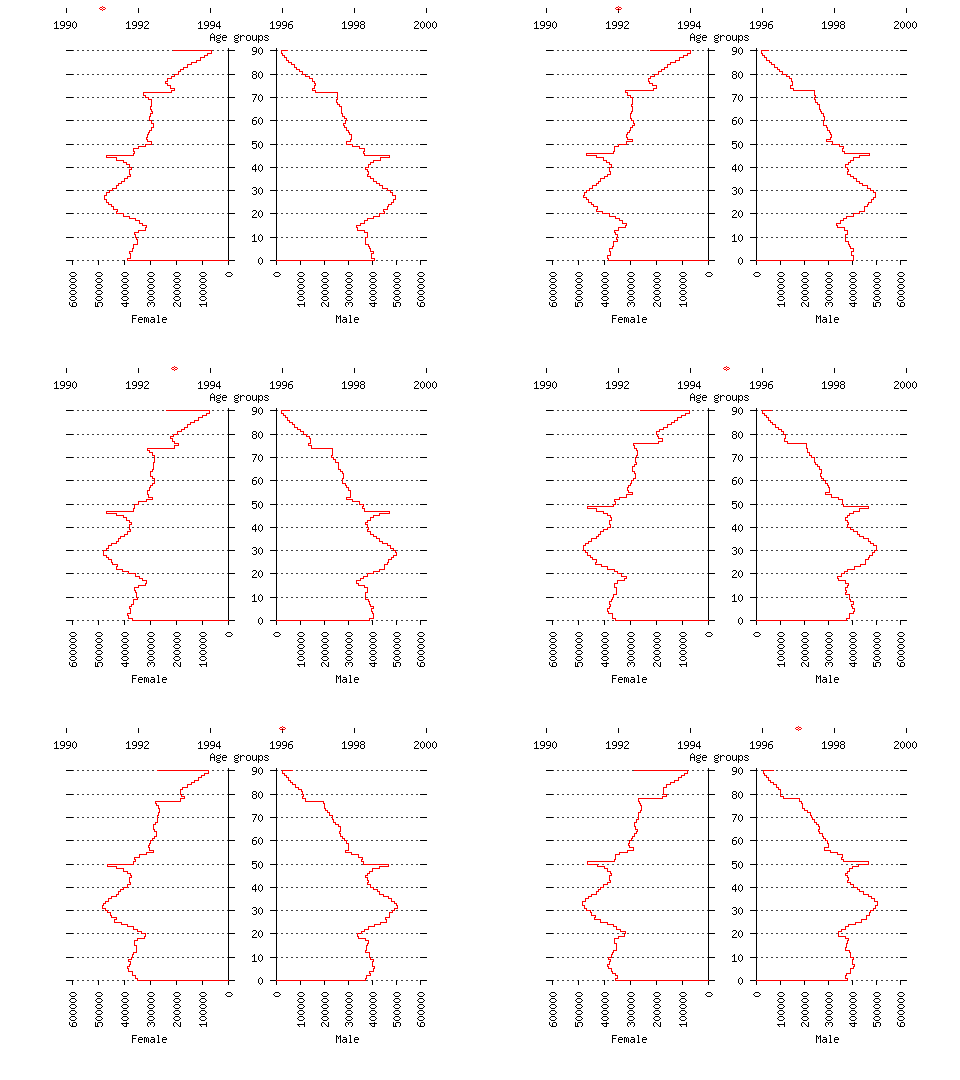
Source: Mid-year population estimates; ONS, GRO(S), CONI. Crown Copyright.
Notes
Figures are for persons per single completed year of age.
The highest age group is marked here as '90'. It is, in fact, '90+', and the extension of the bars for this age group is deliberate.
The animation cycles continuously over the same seven frames.