Return to GeoComputation 99 Index
Brian J. Schumacher and Michael Leitner
Department of Geography and Anthropology, Louisiana State University, Baton Rouge, LA U.S.A.
E-mail: bjschu@juno.com
E-mail: mleitne@unix1.sncc.lsu.edu
The city of Baltimore, Maryland has received widespread acclaim for the aggressive programs of urban renewal it has implemented since the mid-1970s, most notably around the Inner Harbor and the Fells Point sections of its downtown area. The aesthetic improvements and the influx of revenue generated by the programs have been studied at length; however, the effect that these programs have had on the spatial distribution of criminal activity in the city has remained largely unknown. This is especially important because while crime has decreased (due to the urban renewal programs around the Inner Harbor and Fells Point), the city's overall crime rates have remained unchanged and among the highest in the country. The main objective of this research is to determine how the spatial distribution of crime has changed in the wake of the downtown redevelopment and to propose models of spatial crime displacement. Such models will help city planning bureaus and law enforcement agencies in Baltimore, and other urban areas, with pro-active decision making with the goal to decrease overall criminal activities.
The study area for this project includes the Inner Harbor, Fells Point, and adjacent areas, covering three police districts (the first, the second, and the ninth). For this area, address-level crime data (burglaries) have been obtained from the Baltimore City Police Department for the period 1988 through 1996. Additionally, various socio-economic variables have been collected from the 1980 and 1990 U.S. Population Census Bureau. The methods used to develop models of crime displacement include hot-spots and spatial trend analyses. Hot-spots analyses are applied to identify the highest concentrations of burglaries within the study area and how they changed over time due to changes in the census variables. Geographic Information Systems (GIS) technology is used for the storage and analysis of the data, as well as for the development and visualization of the model results.
Baltimore, like many other post-industrial cities in the northeastern United States, suffered through a damaging process of decline following World War II. Rapid decentralization, and the resulting infrastructure decay left portions of the city devoid of investment and laden with crime. To reverse these trends, the city embarked on an aggressive course of urban renewal designed to physically transform portions of downtown Baltimore. This redevelopment, centered first on the Inner Harbor in the late 1970s and early 1980s, and on the areas of Fells Point and Camden Yards during the 1990s, has been widely acclaimed for the aesthetic improvements and large amounts of revenue it generated.
A classic urban waterfront transformation of its time, the Inner Harbor of Baltimore has been studied by planners, developers, and academics around the world because of its stunning success. What was once a collection of derelict piers next to a moribund central business district has . . . become a rich and diverse scheme with attractions and activities centering on a tiny water body (Breen & Rigby, 1996).
While the redevelopment of downtown Baltimore has been heralded, the physical rehabilitation and fiscal success have not come without costs. First, the monetary investment in the area, made by public and private sources, has been staggering. The total cost of the Inner Harbor redevelopment has soared above $2.5 billion, which does not include the projects at Fells Point and Camden Yards (Breen & Rigby, 1996). Second, this money has not been allocated evenly throughout the downtown. Certain areas (such as those mentioned above) were targeted for redevelopment while others (such as the Patterson Park area) were not going to receive the reinvestment. The result has been a city largely divided along lines of investment. These uneven patterns of investment were accompanied by uneven patterns of criminal activity in the downtown. The goal of this project was to determine if the distribution of crime in the city could be related to these patterns of investment. A general model of crime displacement in response to large-scale urban redevelopment was constructed in order to explicate the criminal dynamics of an urban area following urban renewal. This model, if proven valid, could allow police departments to better address the changing needs of their communities by engaging in pro-active policing and directed initiatives. Furthermore, it would allow municipal planners to more accurately and completely assess the impact of their projects.
Central to the formation of this model was the identification of a mechanism, related to the redevelopment, capable of altering the city's crime pattern. Three aspects of the renewal projects were cited as having the potential to influence offender decision-making. These were:
Each of these have been studied individually in other cities as "situational crime prevention" measures (see Press, 1971; Sherman, 1990 for case studies on police manpower crackdowns; see Ditton & Nair, 1994; Painter, 1994 for case studies on improved street lighting; see Mayhew et al., 1980 for a case study on the effectiveness of casual surveillance). In the model, these aspects of the redevelopment were seen as the "push" factors responsible for the changing crime patterns.
Two steps were required to address this issue. First, the high-crime areas in downtown Baltimore had to be identified, and changes in the locations of these areas since the redevelopment needed to be identified. Hot spot analysis, conducted within the Spatial and Temporal Analyst for Crime (STAC) program, was used to detect these changes. This analysis is a method of determining the locations of the highest concentrations of a given activity or phenomenon - in this case, burglary. Second, the crime rates had to be compared with the socio-economic characteristics throughout the downtown, in order to establish some relationship between the changing crime conditions and the changing socio-economic characteristics that emerged following the renewal. The variables chosen reflected the levels of investment (or, disinvestment) throughout the study area. The socio-economic variables included in this study were:
Burglary was the crime that was chosen for the analysis, due to the potential for it to be committed in residential or commercial areas, as well as in either affluent or impoverished neighborhoods. The street address of all reported burglaries committed during 1988, 1990, 1992, 1994, and 1996 were obtained from the Baltimore City Police Department. These addresses were geocoded in a GIS and "hot spots" were calculated for each of the years based on these registered coordinates. This allowed the high crime areas within the downtown to be visualized, and a determination to be made whether or not these areas had changed over time.
In hot spot analysis, ellipses are calculated to represent the areas with the highest concentrations of activity in the study area. Shifts in the locations of these hot spots would indicate whether or not displacement had occurred, as well as the extent of this displacement. STAC calculated the hot spots according to a number of user-defined specifications included in the program's parameter (.prm) file, such as the minimum number of incidents to include in each hot cluster, the search radius, and the type of scan the program conducts to detect the hot spots. Throughout this analysis, the minimum number of incidents was set at 10, the search radius was set at 200 meters, and a triangular scan type was used. Variations in these settings can have a large impact on the results of the analysis, so it was necessary to keep these settings constant for all the years considered. The settings were made following a process of trial and error, guided by "rules of thumb" provided in the STAC user manual (Illinois Criminal Justice Authority, 1996). The hot spots generated by STAC provided a picture of the criminal landscape for each year included in the study and, when assessed together, the results for the years revealed the recent dynamics of the crime situation in the city.
The hot spot analysis showed that the distribution of burglary hot spots in downtown Baltimore had changed from 1988 to 1996. In general, there was a trend for the hot spots to move outward from the redeveloped areas around the Inner Harbor, to areas where redevelopment had not occurred. In 1988, STAC identified seven hot spots within the study area, the largest of which was just northwest of the Inner Harbor waterfront in the heart of the old central business district along Charles Street and surrounding the Charles Center Plaza office park. A second hot spot, also located near the center of the study area, partially overlapped with the largest cluster of activity. The second largest hot spot was located north of the largest cluster, while the remaining, smaller hot spots were scattered to the east and west (Figure 1). A similar pattern was found in 1990. Six hot spots were found for this year, with the most noticeable difference being that the cluster at the old central business district (the largest in 1988) had decreased in size, while the hot spot to the north had become much larger (Figure 1). In 1992, STAC identified only five hot spots, as the two in the north-central portion of the study area coalesced into one, large cluster of activity. The remaining hot spots remained scattered towards the fringes of the study area, including the southwestern-most hot spot, located just west of the Camden Yards baseball stadium, which was completed during this year (Figure 2). The most significant change in the distribution for 1994 was the disappearance of the hot spot near the baseball stadium. This could perhaps be attributed to the opening of the facility, which brought with it increased presence of security personnel, pedestrian traffic, and improved street lighting (Figure 2). Perhaps the most dramatic change, however, was found in 1996. In this year, STAC determined that there was no longer a concentration of burglaries in the core, downtown area. Three hot spots were now found in the Patterson Park area, as well as near the western edge of the study area - considerably west of Camden Yards (Figure 3).
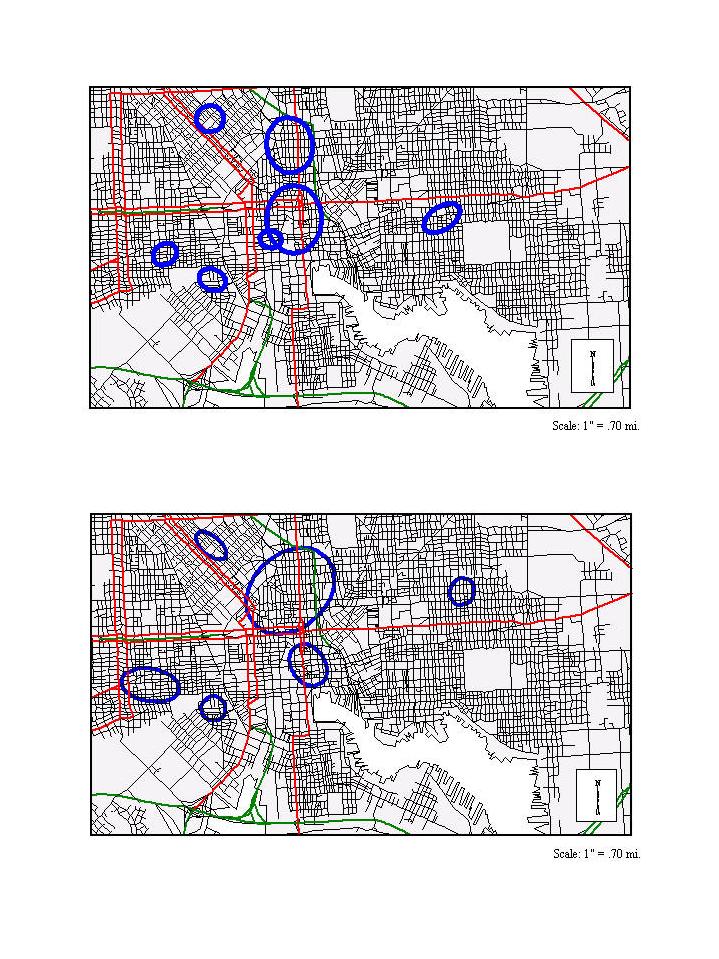
Figure 1: Hot spots of reported burglaries in 1988 (above) and 1990 (below).
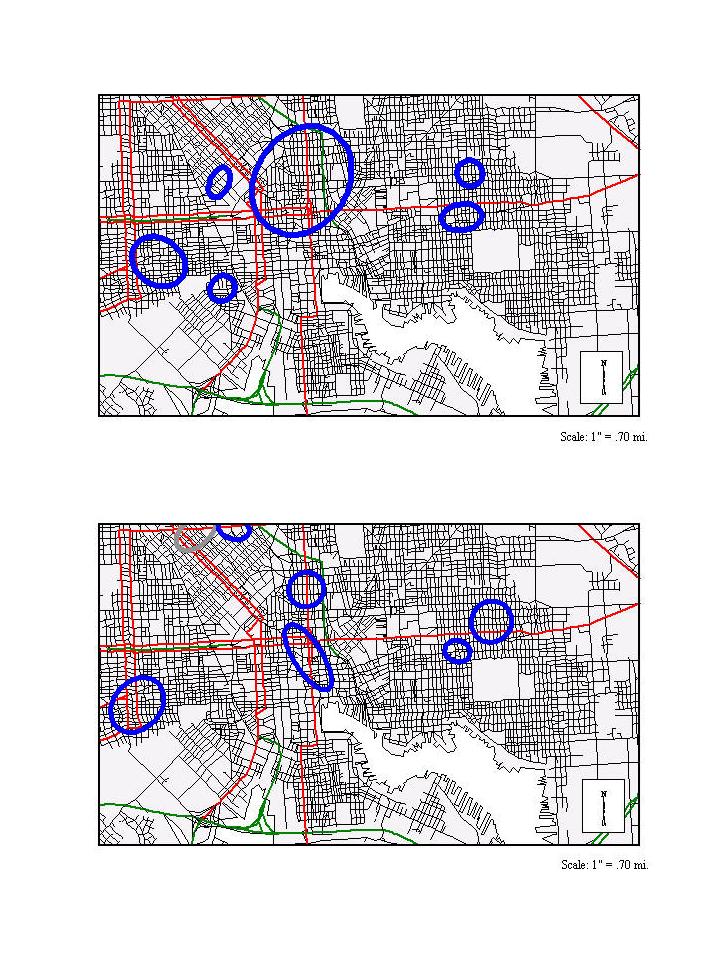
Figure 2: Hot spots of reported burglaries in 1992 (above) and 1994 (below).
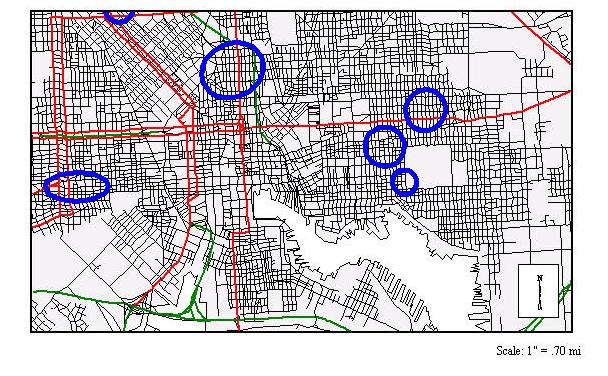
Figure 3: Hot spots of reported burglaries in 1996.
In general, the burglary hot spots moved away from the core of the city's redevelopment, most notably, the Inner Harbor and Camden Yards. Concentrations of burglaries were found adjacent to both these areas in 1988 but, by 1996, these were no longer statistically evident. The hot spots appeared to shift to the more peripheral downtown areas, particularly around Patterson Park. In the redeveloped areas, more reliable, more effective street lights were installed in these areas, private security firms were hired, and visitors flooded to these sections of the downtown. Each of these aspects of the redevelopment could have discouraged a certain amount of criminal activity due to increased risks (either real or perceived) associated with such activity (Clarke, 1992). This appeared to be the case for burglaries within the city, based on the hot spot analysis. The redeveloped areas appeared to benefit from the renewal projects both economically and in terms of crime prevention, while some of the neighborhoods that did not receive renewal funds experienced increased concentrations of burglary.
The previous sections outlined how the spatial distribution of reported burglaries had changed in Baltimore following the city's most recent wave of redevelopment, and suggested that three aspects of the renewal projects could have been responsible (at least in part) for the changes; however, if a motivated offender is discouraged from committing a crime in one place (such as the renewed space of the Inner Harbor), they are likely to still commit the crime, but in an area where the perceived risks of apprehension are diminished (Reppetto, 1976). This is the basic principle behind the concept of crime displacement. The hot spot analysis indicated where there had been increased concentrations of burglary following the redevelopment, but a more detailed analysis was required to determine the relationship between the socio-economic landscape of the city and the landscape of crime. The socio-economic landscape was defined by the following four socio-economic variables:
First, K-Means Cluster Analysis was used to discern four unique "zones" in the downtown area (each comprised of two or more census tracts) based on similarities and dissimilarities of census variables among the tracts. Then, each of the census tracts was assigned to one of six categories for each socio-economic condition:
The mapping of these assignments allowed trends (change from 1980-1990) in the different sections of the downtown to be identified.
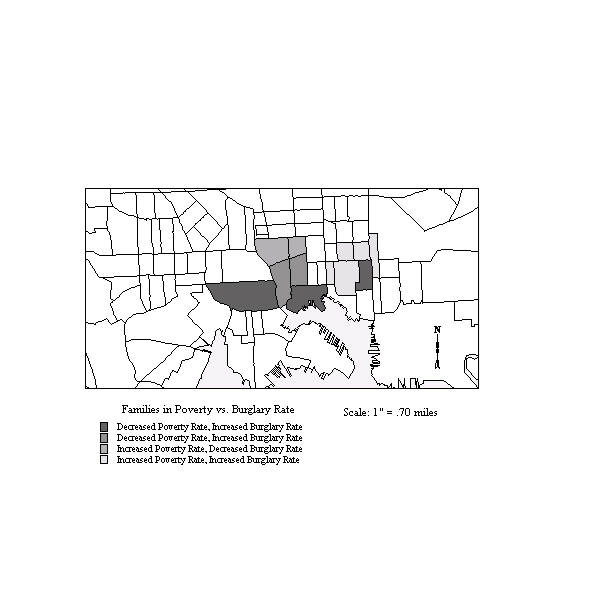
Figure 4: Percent change in families in poverty and burglary.
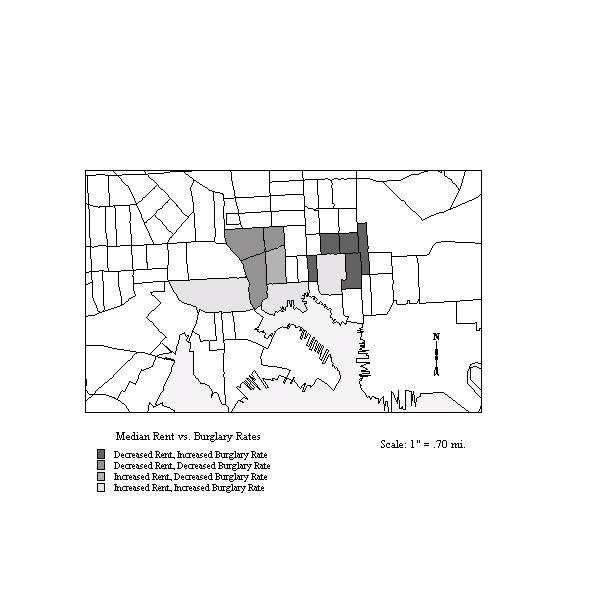
Figure 5: Change in median rent and burglary.
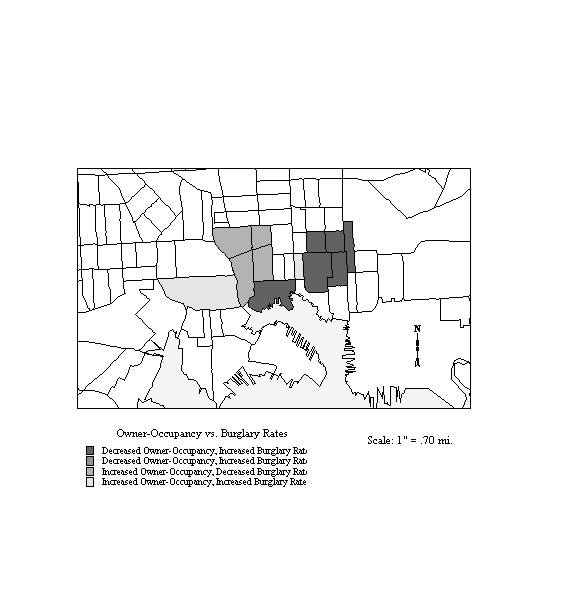
Figure 6: Change in rates of owner-occupancy and burglary.
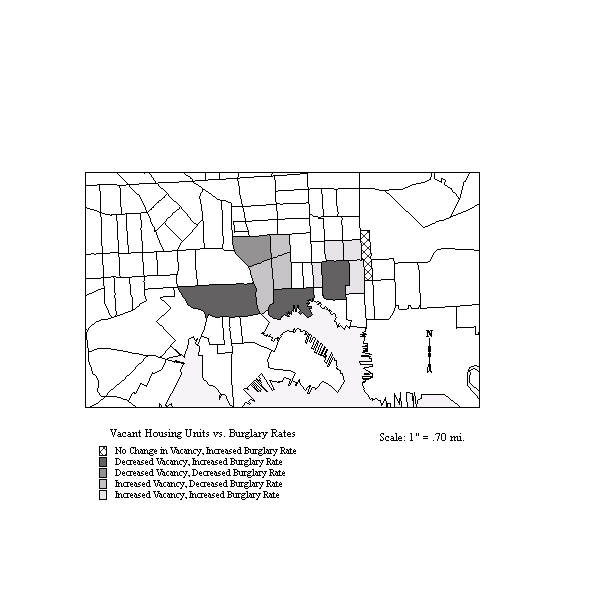
Figure 7: Percentage of vacant housing units and burglary rate.
One strong trend was a change for the worse in socio-economic conditions and an increase in criminal activity in and around Patterson Park. Rates of burglary increased in all six of the tracts in this zone, and the four socio-economic conditions considered generally deteriorated. Another trend was the mix of generally improved socio-economic conditions in the Redevelopment Zone (especially around the Inner Harbor) and crime rates that continued to rise. While this combination of trends in this zone could be seen as contradictory, it has been suggested that crimes are more likely to be reported in areas where a large, visible presence of security personnel has been put in place (Painter, 1994), which could explain this situation. Furthermore, while the rate of burglary may have slightly increased in the census tracts containing the redeveloped areas, the concentrations of this crime around these areas have decreased according to the hot spot analysis. These two portions of downtown Baltimore appear to be headed in opposite directions. The Inner Harbor and Fells Point areas, once filled with poverty and crime have shown signs of substantial improvement. Areas such as Patterson Park, on the other hand, have continued to struggle with these problems. While the different fates of these neighborhoods cannot be attributed to any single factor, the disparity in investment between these areas appears to have played a large role.
The primary goals of this project were to identify, describe, and attempt to explain the changes in the spatial distribution of crime in Baltimore following the city's most recent wave of redevelopment. A general model for displacement, based on the findings in this case, was suggested to account for the changes. According to this model, the differential levels of investment throughout the downtown served as the mechanism for wide-scale shifts in criminal activity.
Three aspects of the city's renewal projects at the Inner Harbor, Fells Point, and Camden Yards were isolated as having the potential to help discourage criminal activity in these areas:
In this model, these features worked as push factors capable of discouraging criminal activity where the redevelopment had occurred; however, the crime rates throughout the city - and in the downtown, overall - remained at high levels despite the redevelopment. This suggested that the renewal programs did not eliminate, but merely displaced, the criminal activity. Hot spot analysis supported this contention. The analysis revealed that a concentration of reported burglaries was no longer evident near the Inner Harbor and Camden Yards areas, but that several new hot spots had emerged outside of these areas of re-investment.
A series of maps, locating the areas experiencing changing socio-economic conditions and changing crime rates suggested a few spatial trends in the changing conditions within the downtown. Perhaps the most significant of these trends was that the census tracts around the Inner Harbor and Fells Point were shown to have experienced improved socio-economic conditions, while the Patterson Park area witnessed deepening socio-economic problems and elevated crime rates.
There is little doubt that other factors have contributed to the changes in Baltimore's landscape of crime. Issues such as the patterns of drug markets and the vagaries of offender decision-making complicate the issue and discourage the simplistic conclusion that a lack of investment equals increased crime; however, the uneven levels of investment throughout downtown Baltimore are apparent (both visually and statistically) and were found to often mirror the uneven levels of burglary in the city. While the city's downtown renewal programs have generated a great deal of revenue and improved the city's image, the tangible benefits of the redevelopment have not reached all of its residents. Those living outside of the redeveloped areas of Fells Point and the Inner Harbor have largely not benefited from these programs. Furthermore, the possible displacement of criminal activity into these neighborhoods suggests that they may have even been harmed (albeit indirectly) by these redevelopment projects.
This research has attempted to further understanding of the relationship between economic re-investment and the distribution of crime. Tools such as computer mapping and point pattern analysis programs (such as STAC) can lead the way in developing such an improved understanding. The complexity of this issue, and the large amount of information (in terms of both crime address locations and census data) available make a versatile and powerful GIS a valuable resource in confronting this problem.
Breen, A. and D. Rigby, 1996. 'The New Waterfront'. New York: McGraw-Hill.
Clarke, R.V. Ed., 1992. 'Introduction'. In: Situational Crime Prevention: Successful Case Studies. New York: Harrow and Heston.
Ditton, J. and G. Nair, 1994. 'Throwing Light on Crime'. Security Journal, 5, 3, pp. 125-132.
Illinois Criminal Justice Information Authority, 1996. STAC: Space Analyzer User's Manual. Chicago: State of Illinois.
Mayhew, P., R.V. Clarke, M. Hough, and S.W.C. Winchester, 1980. 'Natural Surveillance and Vandalism to Telephone Kiosks'. In: Designing Out Crime. R.V. Clarke and P. Mayhew, Eds., London: HMSO.
Painter, K, 1994. 'The Impact of Street Lighting on Crime'. Security Journal, 5, 3, pp. 116-124.
Press, S.J., 1971. Some Effects of an Increase in Police Manpower in the 20th Precinct in New York City. New York: Rand Institute.
Sherman, L.W., 1990. 'Police Crackdowns: Initial and Residual Deterrence'. In: Crime and Justice: A Review of Research, Vol. 12. M. Tonry and N. Morris, Eds., Chicago: University of Chicago Press.