Return to GeoComputation 99 Index
*On behalf of the SIESIP Team
The EOSDIS original centralized design can afford baseline products but cannot easily provide more focused data products in support of all possible specific science communities and flexible new information technology developments are hard to be integrated. Therefore, in its 1995 study of the USGCRP and NASA’s Mission to Planet Earth, the NRC’s Board on Sustainable Development recommended augmenting the current EOSDIS system through the formation of a federation of Earth Science Information Partners (ESIPs) consisting of several independent data information entities providing innovative solutions to Earth science data systems (BSD, 1995). According to the report, the principal enabling technology which could be utilized by such ESIPs is the World Wide Web. The NRC recommended that "Responsibility for product generation and publication and for user services should be transferred to a federation of partners selected through a competitive process open to all". The intent was for NASA to share the processing and distribution tasks with universities and other research labs where additional talent and expertise could come to bear on the difficult problem of dealing with the large data sets and the requisite information content in the EOS era.
In response to the NRC recommendations, NASA solicited proposals for a working prototype (WP) ESIP federation in 1997. George Mason University’s (GMU) Center for Earth Observing and Space Research (CEOSR) and faculty from other GMU units, the Center for Ocean-Land-Atmosphere Studies (COLA), and the Goddard DAAC submitted a collaborative proposal, which was selected for funding.
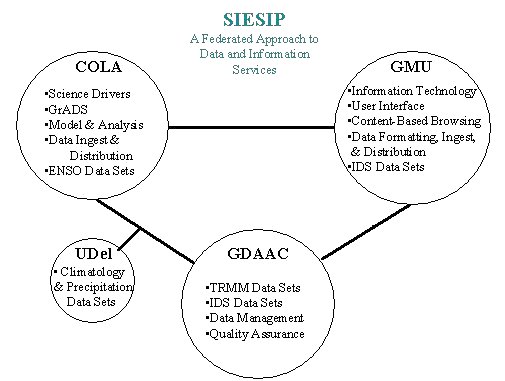
Figure 1
The GMU-led consortium focuses on seasonal-to-interannual processes (S-I) and consists of a distributed data and information technology system with a division of tasks as shown in Fig. 1. The SIESIP consortium (http://www.siesip.gmu.edu/) is designed to be an innovative source of climate data to S-I researchers, TRMM scientists as well as process studies such as hydrological processes and regional experiments in the tropical Pacific. SIESIP is a full participant in the ESIP federation, one of the 12 ESIP-2 projects (which focus on science) selected by NASA (NASA, 1997) and as such it will conform to the federation rules, interoperability protocols and interoperability standards to be decided by the WP-ESIP federation. SIESIP is a science-driven effort, with a design formulated through science drivers and the associated technology which assist the conduct of the scientific goals by its user communities. In other words, the requirements of the seasonal to interannual climate variability and prediction user communities are the fundamental drivers of the entire information system, including the information technology, distributed architecture and its associated software and hardware (http://www.siesip.gmu.edu/ science.html).
In Figures 2 and 3, we show the main distributed tasks of the ESIP Consortium members and the distribution of user access, analysis and ordering queries (see below).
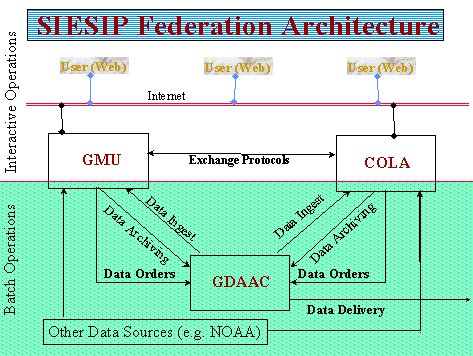
Figure 2
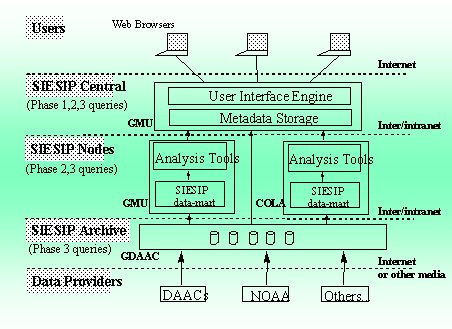
Figure 3
SIESIP’s overall goal is to assist S-I climate scientists with both data and information solutions. In practical terms, the SIESIP consortium consisting of the three main distributed sites is focusing on the following distributed tasks: George Mason University with expertise in information technology, data searches and analysis, and interdisciplinary Earth system science. More specifically, GMU’s contribution is in information technology design and implementation, leveraging existing prototypes (funded by NASA) such as the Virtual Domain Application Data Center (http://www.ceosr.gmu.edu/~vdadcp/ vdadc/vdadc.html), or VDADC a project which resulted from GMU's 1994 study of alternative architectures for EOSDIS (Kafatos et al., 1994). The VDADC focuses on global data sets, available via the WWW, by utilizing on-line tools which allow the user to obtain a quick look of the data before proceeding to order them. The architecture and GUI of the VDADC are shown in Fig. 4 and 5, respectively (Kafatos et al., 1997).
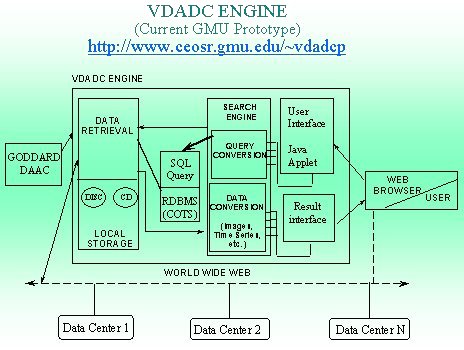
Figure 4
GMU is building the database and porting data to the SIESIP server, linking them to the on-line analysis tools as well developing innovative data mining and search capabilities. GMU is also focusing on interdisciplinary users and graduate students. COLA, on the other hand, is providing science scenarios, analysis data such as NOAA data sets, as well as enhancing the S-I popular graphical analysis tool GrADS for satellite data and other functions (http://grads.iges.org/grads/head.html). The Goddard DAAC is contributing data management to the consortium and will assume some of the operational data distribution roles (http://daac.gsfc.nasa.gov/DAAC_DOCS/gdaac_home.html).
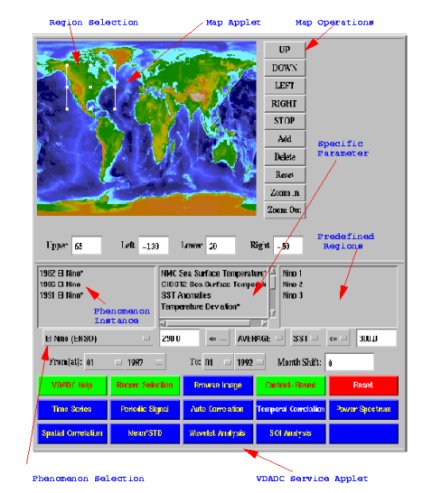
Figure 5
Data are being supplied by the University of Delaware which has considerable expertise in climatology and station (rain gauge arrays) data as well as by GDAAC which is supplying TRMM subsets and regional precipitation data in support of the South China Sea Monsoon Experiment, also known as SCSMEX.
The SIESIP consortium adheres to the federation goal of getting "real data to real people", i.e. help to expand the user communities by making available data sets which are new and useful. The GMU/COLA/DAAC/UDel consortium is to serve S-I and other related scientists who have requirements for data and the means to get to these data.
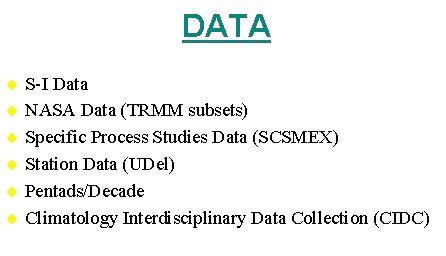
Figure 6
Other user communities SIESIP serves are TRMM scientists, working on GCM intercomparison studies; hydrology and other interdisciplinary science investigators; other process studies such as SCSMEX (Fig. 6). Specifically for TRMM, data subsets are being assembled as described in Figure 7.
The data products in the SIESIP inventory are chosen to facilitate research and data access for
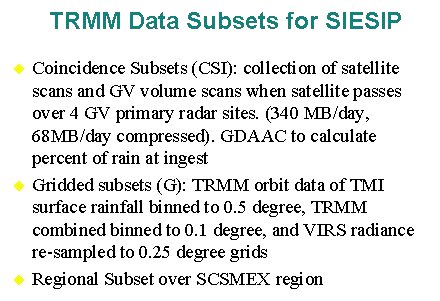
Figure 7
particular seasonal-to-interannual phenomena such as the El Nińo/Southern Oscillation (ENSO), monsoons event-driven phenomena (hurricanes, etc.). On-line preliminary analysis of ENSO teleconnections, interdisciplinary tools such as temporal lags among phenomena, etc. will be built-in as tools to the WWW search mechanism. The data sets are generally global and prepared on uniform grids (1 degree x 1 degree) and same temporal specifications (monthly mean, 5-day or 10-day mean), i.e. so-called level 3 (L3). Higher resolution data sets, e.g. SCSMEX, are also being prepared. Similarly, the present prototype VDADC has developed a suite of data products (Table 1) in order to facilitate interdisciplinary Earth scientists and geoscientists.
In the first year of the project we have already developed the following products:
The data sets can be accessed at the SIESIP home page, athttp://www.siesip.gmu.edu/data.html. Similar enhanced and additional products will be developed in subsequent years.
TABLE 1
VDADC Data Products
| Description | ID | Time Coverage | Spatial Coverage | Range | Unit | Processing Level |
| Total Precipitable Water | ssmi.prch2o | 08/87--11/91 | Ocean | 0.0--6.0 | Cm | L3 |
| Sea Surface Temperature | cacsst.sst | 01/82--09/92 | Ocean | 271.4--308.2 | K | L3 |
| NDVI | avhrrpf.ndvi | 01/82--12/92 | Land | 0.05--0.65 | Pure number | L3 |
| Wind Fields (2 deg. x 2 deg) | assim54A.wndvec | 03/85--11/93 | Land | (-25)--25 | Vector m/s | L4 |
| Precipitation | gpcc.pcp | 01/86--12/94 | Land | 0.0--1800.0 | Mm | L3 |
| Temperature Deviation (5 deg. x 5 deg.) | E_Anglia.tmpdev | 01/84--12/94 | Global | (-9)--12 | C | L3 |
| Surface Skin Temperature | tovsng.tsurf | 01/87--12/90 | Global | 271.2--320.0 | K | L3 |
The SIESIP design is based on a multi-tiered client-server architecture, or as an information system of three physical sites or nodes, distributing tasks in the areas of user services, access to data and information products, archiving as needed, ingest and interoperability options and other aspects, enabled by a low-cost, scalable information technology architecture. The information technology is built to allow on-line search, data access, analysis and ordering for the user communities served by the system. To enable these functions, i.e. for easy access and WWW-enabled browsing and analysis capabilities, we have chosen as the central tool used by the SIESIP engine an enhanced version of GrADS (Doty and Kinter, 1995), presently under development , which is integrated into a database management system.
The SIESIP user interface allows a user to query the system and search the holdings of the climate SIESIP data (at GMU, COLA, GDAAC or UDel) to obtain an idea of data sets available as well as to obtain a quick estimate of the content of data sets available--this is termed "content-based browsing" (see below). There are, correspondingly, three phases of user interaction with the data and information system (see also Fig. 3). Each phase can be followed by other phase(s) or can be conducted independently (Kafatos et al., 1998).
Phase 1: Using the metadata and browse images provided by the SIESIP system, the user browses the data holdings. Organizing knowledge is incorporated in the system (i.e. the system contains information-rich products).
Phase 2: The user gets a quick estimate of the type and quality of data found in phase 1. Analytical tools are applied as needed including statistical functions and visualization algorithms available via WWW. The SIESIP interface also incorporates a spectrum of statistical data mining algorithms as needed. We have also begun to implement tools for finding positive correlations among different data types, providing a realistic, human-aided data mining capability. We have applied this approach and other data mining systems (Li , Kafatos and Michalski, 1997) to ENSO teleconnections with possible results in identifying anti-correlations with vegetation in tropical Africa and in the NE coastal U.S. (Li and Kafatos, 1999).
Phase 3: The user has located the data sets of interest and is ready to order. If the data are available through SIESIP, it will handle the data order; otherwise, an order will be issued to the appropriate data provider (e.g. GDAAC) on behalf of the user, or necessary information will be forwarded to the user for this task.
These phases will be transparent to the user and as such attest to the distributed nature of the SIESIP consortium, which operates in a mini-federation fashion. In other words, Phase 1 allows the user to search and discover what data are in the system. Phase 2 allows preliminary on-line analysis, with information obtained on the content of data. Phase 3 allows the user to retrieve data for further analysis at the user's own site.
SIESIP promotes ease of use for the user communities it serves by deploying innovative products and information technology and allowing users to locate, browse and order data easily. SIESIP assists scientists and its different communities by collecting relevant data sets into a single point of access, at GMU, integrating complementary data sets to enhance information, and producing needed products. Moreover, a single analysis tool (GrADS) is applied across diverse data sets, creating ease of use and compatible data interuse. As such, the SIESIP consortium will create an interdisciplinary Earth science source of data for S-I researchers in order to expand the usage and usefulness of NASA data for these communities and allow the merging of diverse model and satellite data sets. The consortium under guidance by an advisory board of science experts is selecting the most appropriate data from the GDAAC, NOAA, COLA, the University of Delaware as well as other data sources for S-I research applications. Finally, we are building a system where metadata and summary statistics are extracted and stored in databases at GMU for more efficient on-line searching (Li et al., 1998).
The distributed information system implementation design is shown in Figure 8. We see that several functionalities can be supported at a variety of different physical nodes. The system allows more physical nodes to join the mini-federation by providing new data sets and services. As such, the SIESIP consortium can provide useful lessons of implementing interoperability across diverse nodes. Protocol development is presently under way between GDAAC and GMU including data ingest implementations.
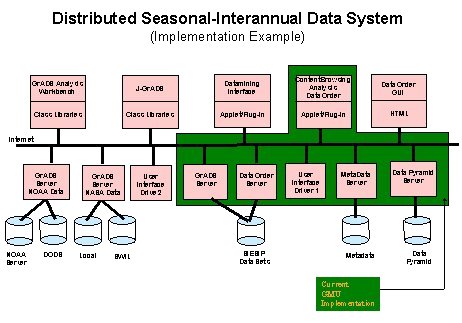
Figure 8
To succeed in the above strategy, SIESIP is developing sets of metadata which can be used to implement phases 1, 2 and 3. For example, the principle guiding the first phase is to reveal, as quickly as possible, what data in the SIESIP inventory might be useful to the user. As such, besides the usual "description metadata" (which include catalogue and inventory metadata) providing information such as scientific investigation, phenomenon under investigation, relevant parameter(s), holdings, etc., the system contains pre-computed "content-based metadata" which are pre-computed statistical properties of the underlying data. Content-based browsing and its associated Data Pyramid (Li et al., 1998) have several advantages (Fig. 9). This phase is presently being implemented as a client-based JAVA GUI (see below, Fig. 11), which interacts with the user. Phase 1 is distinguished as a search of the metadata, concluding with a system-generated list of files which the user has identified.
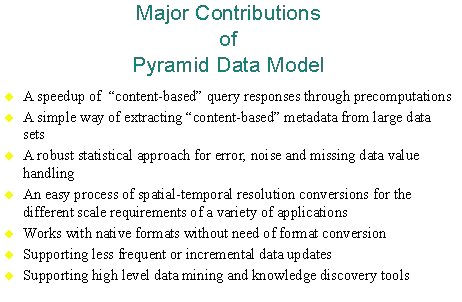
Figure 9
For the description metadata, we have developed an E-R diagram (Fig. 10) which is a simplified version of corresponding data holdings at GDAAC. We are also developing ways to integrate COLA’s data into a searchable metadata schema. At present, data sets from UDel have been ingested into the database and we are in the process of ingesting SCSMEX and TRMM subsets as well.
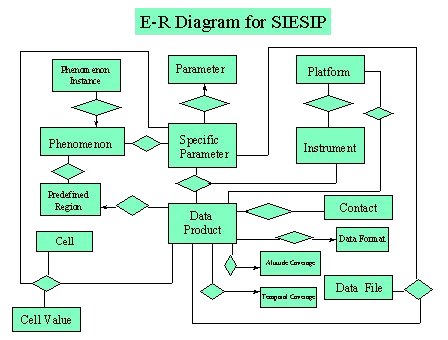
Figure 10
The second phase builds upon the results of the first phase. The file list is then used to present pre-computed reduced-resolution representations of the data. These representations of the data and the associated content-based metadata constitute an innovative data pyramid (Li et al., 1998), which allows rapid data searches and their content to be performed on-the-fly. The representations in the data pyramid allow the user to perform preliminary analysis on the data. Although the data are at reduced resolution, the sacrifice is compensated for in speed of processing and the reduction of network traffic. Certain calculations, such as correlations between related parameters are optimized.
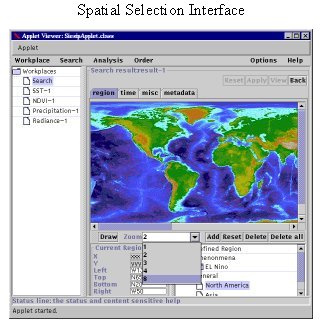
Figure 11
The third phase assumes the researcher is now ready to proceed with data ordering, following the preliminary results obtained in the second phase. The researcher may then place an order through the interface for access to the high-resolution data as needed. The requested data will either be staged for ftp pickup or the request will be submitted to the GDAAC if the data are not stored at the SIESIP GMU site.
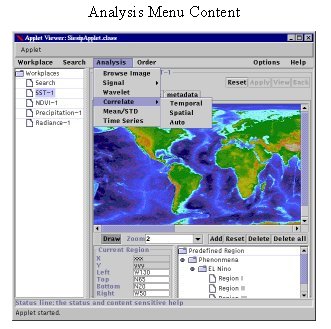
Figure 12
Figure 11 above shows the JAVA-based WWW (based on the Swing technology) user interface (the particular figure shows the spatial section GUI) or GUI featuring three advances: 1) content-based searching of the summary metadata 2) exploratory analysis of on-line data and 3) phenomenon-based searching. The GUI allows the user to place in her "Workplace" the data sets that are needed. The GUI has metadata and description capabilities of the appropriate parameters stored at the SIESIP. Analysis functionalities (Fig. 12) include browsing of images in user-specified regions; wavelet and principal component analysis decompositions; times series, etc.
In the first year, we have already developed a rapid implementation of the system. The results can be found at the URL http://www.siesip.gmu.edu/deliverables/deliverables.html. The URL gives all important developments including data, architecture, information about ingest and interoperability (which could be useful for the wider ESIP federation, http://www.ceosr.gmu.edu/~esipfed/ ).
In summary,
*Members of the SIESIP team include: B. Doty, J. Kinter & C. Steinmatz (COLA); C. Lynnes & G. Serafino (GDAAC); P. Chalermwat, L. Chiu, T. El-Ghazawi, P. Hertz, Z. Li, J. McManus, J. Vongsaard, C. Wang, X.S. Wang, H. Weir, K-S. Yang & R. Yang (GMU); K. Miyakoda, P. Schopf & J. Shukla (GMU & COLA); C. Willmott & K. Matsuura (UDel); and H. Wolf (IRMA).
Board on Sustainable Development. (1995) A Review of the U.S. Global Change Research Program and NASA’s Mission to Planet Earth/Earth Observing System. National Academy Press, 96 pp.
Doty, B.E. & Kinter, J.K. III. (1995) Geophysical Data Analysis and Visualization using GrADS. Visualization Techniques in Space and Atmospheric Sciences. eds. E.P. Szuszczewicz and J.H. Bredekamp. NASA, Washington, D.C. 209-219.
Kafatos, M., et al. (1994) The GMU ECS Federated Client-Server Architecture, Contract ECS-00010, http://www.ceosr.gmu.edu/indy-study/indy-study.html.
Kafatos, M., Li, Z., Yang, R., et al. (1997) The Virtual Domain Application Data Center: Serving Interdisciplinary Earth Scientists. Proceedings of the Ninth International Conference on Scientific and Statistical Database Management. IEEE.264-276.
Kafatos, M., Wang, X., Li, Z., Yang, R., Ziskin, D. (1998) Information Technology Implementation for a Distributed Data System Serving Earth Scientists: Seasonal to Interannual ESIP. Proceedings of the Tenth International Conference on Scientific and Statistical Database Management. IEEE.210-215.
Kyle, H.L., McManus, J.M., Ahmad S., et. al. (1998). Climatology Interdisciplinary Data Collection, Volumes 1-4, Monthly Means for Climate Studies. NASA Goddard DAAC Science Series, Earth Science Enterprise, National Aeronautics & Space Administration, NP-1998 (06)-029-GSFC.
Li, Z., and Kafatos, M. (1999) Interannual Variability of Vegetation in the US and its Relation to ENSO. Remote Sensing of the Environment (in press).
Li, Z., Kafatos, M., Michalski, R. (1997) Data Mining Application for El Nińo Teleconnection Research. GMU Machine Learning Laboratory Report.
Li, Z., Wang, X. S., Kafatos, M., Yang, R. (1997) A Pyramid Data Model for Supporting Content-based Browsing and Knowledge Discovery. Proceedings of the Ninth International Conference on Scientific and Statistical Database Management. IEEE.264-276.
NASA Press release, Dec. 2, (1997). NASA Selects Earth Science Information Partners. http://www.nasa.gov/releases/1997/.
UDel (1999) Climate Station Data Products, http://www.siesip.gmu.edu/presentations/climfields.html.