
 |
Return to GeoComputation 99 Index
Linda See
Centre for Computational Geography, School of Geography, University of Leeds, Leeds, LS2 9JT, U.K.
E-mail: L.See@geog.leeds.ac.uk
Robert J. Abrahart
School of Earth and Environmental Sciences, University of Greenwich, U.K.
E-mail: bob@ashville.demon.co.uk
This paper outlines some neural network data fusion strategies for continuous river level forecasting where data fusion is the amalgamation of information from multiple sensors and/or different data sources. The objective of data fusion is to provide a better solution than could otherwise be achieved from the use of single source data. The simplest data-in-data-out fusion architecture involves the combination of input data from multiple sources. In this paper, the sources are continuous river level forecasts derived from a set of conventional, fuzzy logic, and neural network models, which are amalgamated via a feed-forward neural network. The data fusion methods are demonstrated using data from sites located in contrasting catchments: the Upper River Wye and the River Ouse. The potential improvements that can be achieved through the implementation of these types of amalgamation methodologies could have significant implications for the design and construction of automated flood forecasting and flood warning systems.
Data fusion is an emerging area of research that covers a broad spectrum of application areas ranging from ocean surveillance, strategic warning, and defense to law enforcement and medical diagnosis (Hall, 1992). The principal objective of data fusion, which is the process of combining or amalgamating information from multiple sensors and/or data sources, is to provide a solution that is either more accurate according to some measure of evaluation, or allows one to make additional inferences above and beyond those that could be achieved through the use of single source data alone (Dasarathy, 1997). The general concept is analogous to the manner in which humans and animals use a combination of multiple senses, experience, and the ability to reason to improve their chances of survival; furthermore, with the provision of data from new types of sensors, the development of advanced fusion algorithms and the proliferation of high performance computing, real-time data fusion has become a practical set of flexible technologies that can be implemented within a desktop environment. Most developments in data fusion have been motivated through funding from the military where the optimal processing of distributed information has been an active area of research, e.g., location, characterisation and identification of dynamic entities for surveillance and target recognition. Data fusion also provides new modelling opportunities in other areas of the physical and social sciences, which includes geographical and environmental research. The management and operation of hydrological systems in particular may benefit from the ability to combine information derived from multiple sources such as the output from different models. There are many different hydrological modelling strategies in existence, including conventional and artificial intelligence approaches, black box and conceptual solutions, and the most complex physical-based models. Each type of model is often able to capture some aspect of the hydrological record better than another, including the ability to cope with changing conditions. Thus, it is desirable to exploit the strengths of each individual approach and potentially produce a better overall solution. There are many different data fusion algorithms available including Bayesian inference, Dempter-Shafer theory, neural networks, and rule-based reasoning systems (Hall & Llinas, 1997). In this paper, two different neural network data fusion strategies are outlined as applicable to continuous river level forecasting. The data sources are individual forecasting models that were derived using conventional methods as well as fuzzy logic and neural network approaches. Two different neural network implementations were developed using combinations of different input data for the prediction of (a) absolute and (b) differenced river flow values. Historical data for the Upper River Wye and the River Ouse catchments in the United Kingdom were used to test these neural network data fusion strategies. Final assessment was based on global goodness of fit statistics and visual inspection of the forecast hydrographs. The mean and median values derived from mathematical and geometrical averaging are also provided as alternative benchmarks for comparison.
Data fusion can involve serial, parallel, or mixed strategies of data combination. This is a wide-ranging subject and the literature reveals a lack of standardisation in the terminology used to describe individual applications. Data fusion researchers can also be divided into two broad groups (Dasarthy, 1997). The first take the view that data fusion is the amalgamation of raw information to produce an output while the second advocate a more generalised view of data fusion in which both raw and processed information can be fused into useful outputs including higher level decisions. The latter view is adopted in this paper, i.e., that data fusion should embrace a flexible approach for combining multi-source information with few restrictions on the type or format of the input data. The basic problem is one of determining the correct procedures for using or interpreting the multisource or multisensor data in a purposeful and meaningful manner, especially when fusion involves multiple data formats, and different resolutions. For example, a medical diagnostic fusion program might use data from multiple sensors, such as x-rays, nuclear magnetic resonance, and ultrasound, as well as symptoms reported by the patient to generate a conclusion about the patientís condition (Hall, 1992).
The general lack of standardisation in this field has resulted in a number of different ways of describing data fusion implementations; this includes differentiation by application domain, the objective of the exercise, the types of data and data sensors used, and the degree or level of fusion involved, i.e., the types of information fused and product(s) obtained. Dasarathy (1997) used this latter characterisation as a flexible approach for describing different data fusion architectures. Figure 1 outlines the simplest implementation, referred to as the data-in-data-out (DI-DO) architecture, in which input data from multiple sources are amalgamated to produce output data, such as in the processing of multispectral data, or when combining data from sensors with different resolutions.
Figure 1: Data-In-Data-Out (DI-DO) fusion architecture

The selected data can be amalgamated using a host of different approaches and mechanisms to produce the desired output; e.g., knowledge-based approaches have been used in expert systems such as INTERNIST and MYCIN (Hall, 1992); Bayesian inference has been used to differentiate between hostile and other aircraft (Wilson, 1985); and neurocomputing has been used to perform face recognition (Lin & Kung, 1997). Data fusion can also operate at more complicated feature-based or decision-based levels, using any combination of input types to produce either a numerical output, a feature output or a higher level decision. For example, an input feature could be the shape of an object, which when combined with the range obtained from another sensor, can be used to calculate an output feature such as the volumetric size of a target. Decisions from individual sensors or sources can be fused into a higher level decision, in the form of an expert system, which represents the most studied data fusion paradigm (Dasarathy, 1994). It is possible to add some intelligence to the data fusion process through the addition of a self-adapting component, as shown in Figure 1. Each output could then be fed back into the amalgamating system using an adjustment mechanism, or the tool could be recalibrated in real-time to include each new output using a learning mechanism, which would allow for long-term changes to be incorporated. The simple DI-DO architecture used in this paper is intended to demonstrate the potential use of data fusion techniques for river level forecasting, although both decision and adaptive data fusion implementations might have more significant implications for the design and construction of automated real-time flood prediction and flood warning systems.
Individual models were developed at each site as listed in Table 1. Brief details regarding the development of the individual models for the Upper Wye and the River Ouse are provided below. Further details regarding the development of these models can be found in Abrahart et al. (1998), See et al. (1998) and See & Openshaw (in press).
Table 1. List of the individual forecasting models developed at each site
|
Upper River Wye |
River Ouse |
|
TOPMODEL |
Hybrid neural network (HNN) |
|
Feed-forward neural network (NN1) |
ARMA[1,2] model |
|
Feed-forward neural network after weight-based pruning (NN2) |
Rule-based fuzzy logic model (FLM) |
|
Feed-forward neural network after node-based pruning (NN3) |
Naive predictions |
|
ARMA[1,2] model |
--- |
|
Naive predictions |
--- |
This is a small upland research basin that has been used on several previous occasions for hydrological modelling purposes, e.g., Bathurst (1986) and Quinn & Beven (1993). Hourly data were available for the gauging station at Cefn Brwyn for a 3-year period from 1984 to 1986. Modelling was implemented on a one- step-ahead prediction, i.e., an hourly forecasting horizon. Each model was trained or calibrated on 1985 data and validated on 1984 and 1986 data.
TOPMODEL (Beven & Kirkby, 1979) forecasts were acquired for the Upper River Wye. This is a physically-based process model that was first developed in the late '70s. TOPMODEL was calibrated on 1985 data and additional predictions were computed for 1984 and 1986 (Rob Lamb, Institute of Hydrology) using the reported parameterisations of Quinn & Beven (1993). These predictions were available for the nine snow-free months (April to December) of each year. Three annual feed-forward neural network solutions derived from hydrological and meteorological data were also available (NN1, NN2 and NN3). NN1 used 22 inputs comprising past river flow values, rainfall, potential evapotranspiration, and seasonal indicators to predict the next river flow value. NN2 and NN3 were based on the same network architecture and input-output data but training included a connection-based pruning algorithm in NN2 and a node-based pruning algorithm in NN3. To provide additional model inputs, an ARMA[1,2] model (Box & Jenkins, 1976; Masters, 1995) was developed on the 1985 data, and validated on 1984 and 1986 data, and a set of naive predictions, which assume the current value as the forecast, were computed.
This catchment covers an area of 3,286 km2 and encompasses an assorted mixture of urban and rural land uses. Four years of hourly data between 1989 and 1992 from a gauging station at Skelton were used in this study. This station is located far from the headwaters of the catchment and has a relatively stable regime so a 6-hour forecasting horizon was chosen. The first 60% of the data set were used for training/calibration while the remaining 40% were used for validation.
A hybrid neural network (HNN), an ARMA model, a rule-based fuzzy logic model, and naive predictions were developed. The HNN consisted of five feed-forward neural networks that were trained using the backpropagation algorithm on five subsets of the data, partitioned according to membership of five hydrograph event types, where an event type is defined as a characteristic section of a hydrograph such as the rising limb. A self organising map (Kohonen, 1984) was used to partition the historical level data into the event profiles. The five neural networks were amalgamated into a single hybrid model via a fuzzy logic controller that determined which weighted combination of network predictions to use for a given set of river-level conditions. To provide additional individual model inputs, an ARMA[1,2] model and a rule-based fuzzy logic model (FLM) were developed on the training data, along with naive predictions. For the FLM, five input variables were used, including change in river level over the past 6 hours, current daily rainfall and river levels at three upstream stations. The output was the change in level at t+6.
Neural networks have been used in several data fusion applications to combine inputs from different sources (Prieve & Marchette, 1987; Widrow & Winter, 1988; Eggers & Khuon, 1989; Foody & Boyd, 1998). Neural networks also can be used in a committee approach (Perrone & Cooper; 1993; Perrone, 1994), where neural network based data fusion is used to combine the predictions arising from a group of individual neural networks that were trained on the same data set. This committee approach can lead to significant improvements in the prediction of new data, while involving little additional computational effort, and the committee can outperform the best single network (Bishop, 1995). This approach would enable the different networks, which were trained and tested during the process of finding the best solution, to be used rather than discarded, and problems associated with a random noise component in new, or unseen data sets, could be minimised (Bishop, 1995). Moreover, this type of approach can be extended to include not just neural networks but other conventional and artificial intelligence-based modelling predictions. The simplest data fusion algorithm associated with a committee structure in a DI-DO architecture would be the calculation of an average value such as the arithmetic mean. This implementation will produce better results when the models have contrasting residuals because these values, when averaged, will in effect act to cancel each other out. The averaging process can also be undertaken with a neural network, which can be trained to learn the best performing solutions, and thus produce a weighted average. The use of weighted averages in which preferential treatment is given to better solutions would be expected to produce a better result than a simple average. The use of additional relevant factors might also allow the network to make a better decision regarding the best combination of model predictions, such as information about current or previous states, or past performance statistics. If the problem space is too complex for a global solution, a set of expert networks can be developed to tackle different parts of the solution space, and the results amalgamated via a controlling network that decides which of the expert networks should be used under a given set of circumstances; for example, see Jacobs et al. (1991) and Abrahart & See (in prep.).
In these experiments the individual model forecasts at the two river sites were amalgamated via feed-forward neural networks trained with backpropagation. Two implementations were undertaken, which differed in terms of the input and output data.
DF1: The absolute values of each original forecast formed the inputs to each data fusion network, which was trained to forecast river conditions at 6 or 1 hour ahead, depending on location.
DF2: The differences between the original forecasts and the current value, together with the actual value at the current time step, formed the inputs to each data fusion network that was used to forecast the difference in river conditions at 6 or 1 hour ahead.
The data fusion operations for the Upper Wye were based on training data for the nine snow-free months of 1985, whereas data fusion for Skelton was based on the first 60% of the 4-year record. The remaining data were used for validation. Training was performed using data normalised between 0.1 and 0.9. Backpropagation training with decreasing learning coefficients and momentum was implemented for 20,000 iterations. Trained networks were saved at 500 epoch intervals, and for each scenario, a best performing network was determined from an assessment of validation errors.
The output from each data fusion implementation was assessed using a combination of global statistics and graphical interpretation. Although mixed results were obtained from these initial experiments, particularly for the flashier catchment, the amalgamated multi-model solutions produced a better result than the use of single source data alone. This suggests that data fusion strategies, such as neural network data fusion, or even simpler amalgamations, such as mathematical and geometrical averaging, have something to offer in terms of improved operational forecasting.
Root Mean Squared Error (RMSE) statistics are provided in Table 2. DF2 produced better results than DF1, especially for the Upper Wye; thus, the basic idea of fusing differenced predictions with the current flow to predict the difference in the output proved beneficial. Statistical assessment also indicates that data fusion produced a poorer performance on the Upper River Wye, which indicates the flashier nature of this catchment. This was further reflected in the R-squared statistics provided in Table 3, which allow for a direct comparison of results between the two sites. DF2 produced the lowest training statistic for the Upper Wye, and also performed well on the 1986 validation data, which contained major floods. But the two averages gave better overall performance on both sets of validation data. The worst results were obtained for 1984, which had a summer drought and poor global data fusion statistics. For the River Ouse at Skelton, in contrast, DF1 and DF2 both produced improvements over the single model methods and the two averages.
Table 2. The root mean squared error for the individual models and each of the multi-model approaches for the Upper Wye and Skelton on the training (T) and validation (V) data sets. The best performing individual and multi-model approach are underlined. Statistics for the Upper Wye are for the nine snow-free months (Apr. to Dec.).
|
|
|
Upper River Wye (m3/hx104) |
Skelton (m) |
|||
|
Approach |
Model |
V (1984) |
T (1985) |
V (1986) |
V 40% |
T 60% |
|
HNN |
|
- |
- |
- |
0.056 |
0.051 |
|
FLM |
|
- |
- |
- |
0.110 |
0.109 |
|
TOPMODEL |
|
1.518 |
1.417 |
1.182 |
- |
- |
|
NN1 |
Individual |
0.611 |
0.461 |
0.582 |
- |
- |
|
NN2 |
|
0.453 |
0.538 |
0.638 |
- |
- |
|
NN3 |
|
0.475 |
0.575 |
0.705 |
- |
- |
|
ARMA |
|
0.398 |
0.668 |
0.706 |
0.098 |
0.082 |
|
Naïve |
|
0.369 |
0.886 |
0.975 |
0.159 |
0.165 |
|
Mean |
|
0.424 |
0.528 |
0.516 |
0.086 |
0.087 |
|
Median |
Multi-model |
0.364 |
0.534 |
0.613 |
0.085 |
0.086 |
|
DF1 |
|
1.350 |
0.660 |
1.900 |
0.011 |
0.017 |
|
DF2 |
|
0.652 |
0.402 |
0.577 |
0.010 |
0.014 |
Table 3. R-squared values for the Upper Wye and Skelton. The best performing individual and multi-model approach are underlined
|
|
|
Upper River Wye |
Skelton |
||||
|
Approach |
Model |
V (1984) |
T (1985) |
V (1986) |
T 60% |
V 40% |
|
|
HNN |
|
- |
- |
- |
0.997 |
0.995 |
|
|
FLM |
|
- |
- |
- |
0.988 |
0.979 |
|
|
TOPMODEL |
|
0.817 |
0.860 |
0.951 |
- |
- |
|
|
NN1 |
Individual |
0.934 |
0.984 |
0.986 |
- |
- |
|
|
NN2 |
|
0.966 |
0.978 |
0.984 |
- |
- |
|
|
NN3 |
|
0.963 |
0.975 |
0.981 |
- |
- |
|
|
ARMA |
|
0.969 |
0.967 |
0.979 |
0.992 |
0.989 |
|
|
Naïve |
|
0.973 |
0.940 |
0.959 |
0.972 |
0.956 |
|
|
Mean |
|
0.970 |
0.979 |
0.989 |
0.992 |
0.987 |
|
|
Median |
Multi-model |
0.976 |
0.979 |
0.986 |
0.992 |
0.987 |
|
|
DF1 |
|
0.790 |
0.966 |
0.939 |
0.999 |
0.999 |
|
|
DF2 |
|
0.929 |
0.988 |
0.986 |
0.999 |
0.999 |
|
Figures 2 and 3 contain selected hydrographs from the validation data sets. Figure 2 comprises flow events from 1984 [a-b] and 1986 [c-f] for the Upper River Wye, while Figures 3a-d are hydrographs for the River Ouse at Skelton. Each plot contains the (a) actual river flow (or level) values and (b) forecasts from the DF2 implementations (the better of the two data fusion strategies). These line graphs are plotted against the range of individual model predictions, which appear as a shaded region on the graphs.
Plots for the Upper River Wye (Figures 2a-f) indicate a strong correspondence between the actual and predicted values, with the largest difference at peak flows. The actual values fall within the range of the original estimates, following the centre at low to medium levels of flow but, on rising limbs these values follow the leading edge of the range, and as the flow increases towards the peak, a clear separation occurs between the individual models. This is followed in most cases by an underprediction of peak flow. Each of the two averages produced a good overall result since these follow a similar path to most predictions at low and intermediate levels, are quite close to the actual values on narrow rising and falling limbs, and attain a near-correct position at peak flow due to the balancing influence of some large overpredictions. The data fusion methods encounter a problem at peak flows since their estimations are biased in favour of lower levels of flow, resulting in a marked underprediction; therefore, some form of correction factor is needed to improve neural network data fusion peak flow prediction, e.g., something to make the network take more notice of certain individual predictions under different catchment conditions such as the inclusion of past performance statistics or other methods for assisting the committee in recognising that peak flow prediction is a special case.
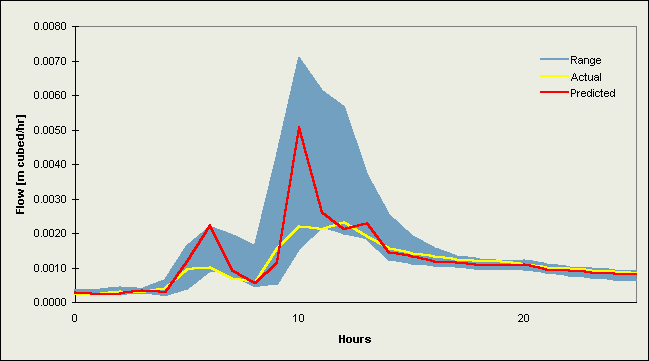
Figure 2a. Plot of a hydrograph for the Upper River Wye from the validation data set starting 7/9/84 11:00
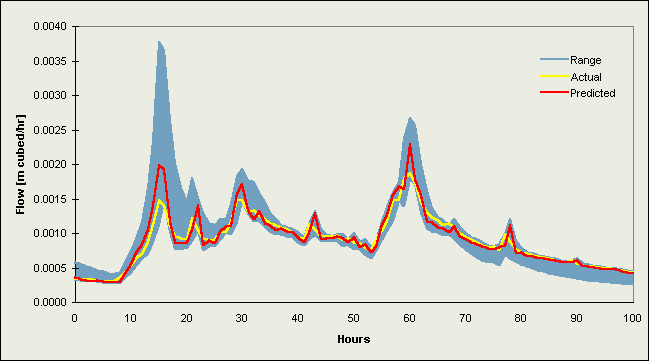
Figure 2b. Plot of a hydrograph for the Upper River Wye from the validation data set starting 20/11/84 07:00
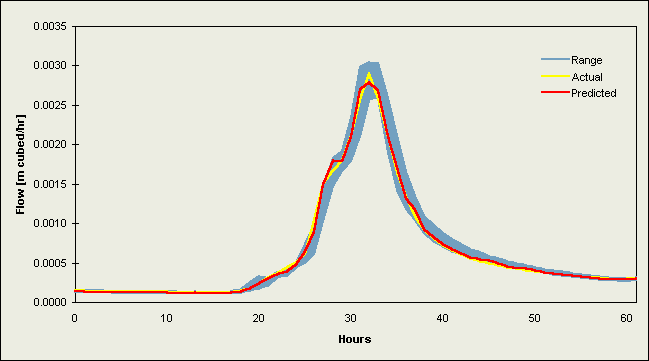
Figure 2c. Plot of a hydrograph for the Upper River Wye from the validation data set starting 17/4/96 22:00
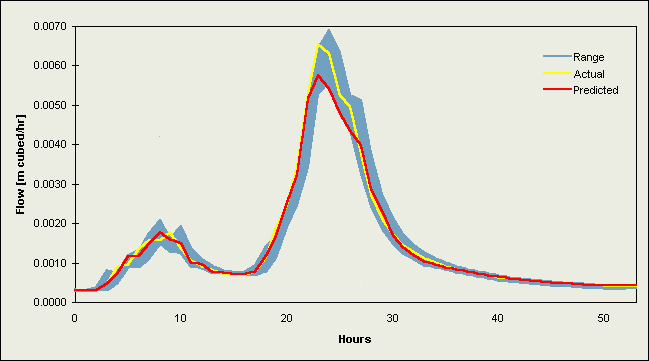
Figure 2d. Plot of a hydrograph for the Upper River Wye from the validation data set starting 24/10/96 02:00
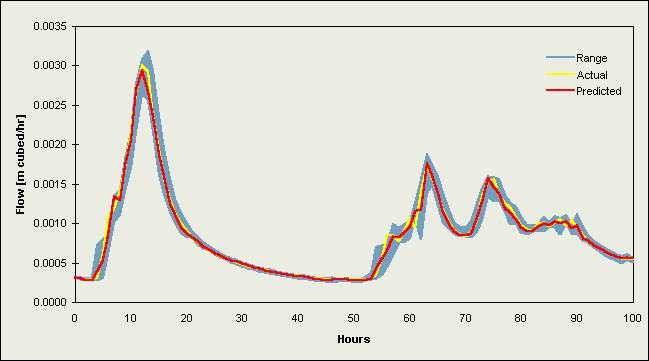
Figure 2e. Plot of a hydrograph for the Upper River Wye from the validation data set starting 16/11/96 23:00
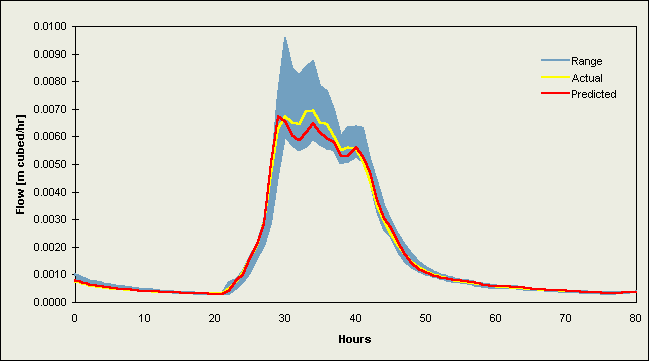
Figure 2f. Plot of a hydrograph for the Upper River Wye from the validation data set starting 27/12/96 16:00
Plots for the River Ouse at Skelton (Figures 3a-d) also indicate a strong correspondence between the actual and predicted values. There is a consistent lag between these values and the range of the individual model estimates, the range appearing as a broad shadow of the prediction, so the data fusion techniques were able to learn this relatively constant pattern. The actual values and the data fusion forecasts follow the leading edge of this range on rising and falling limbs, and peak flows are predicted well. The lack of synchronisation between the actual value and the range of individual model predictions means that the two averages will be lagged except at cross-over points, or in situations where there is little or no change. The two averages produced similar results to the single model implementations and poorer results in comparison to the two neural network data fusion techniques.
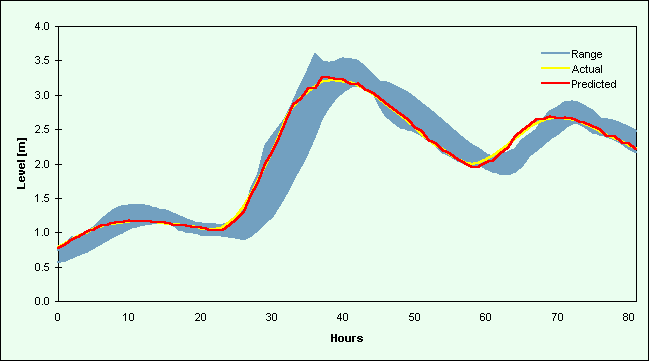
Figure 3a. Plot of a hydrograph for Skelton from the validation data set starting 30/10/91 21:00
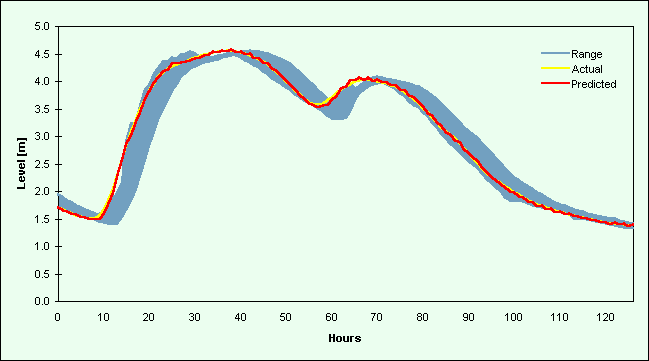
Figure 3b. Plot of a hydrograph for Skelton from the validation data set starting 21/12/91 07:00
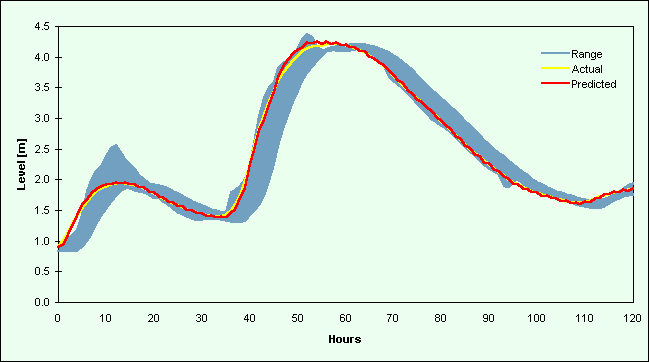
Figure 3c.Plot of a hydrograph for Skelton from the validation data set starting 04/1/92 03:00
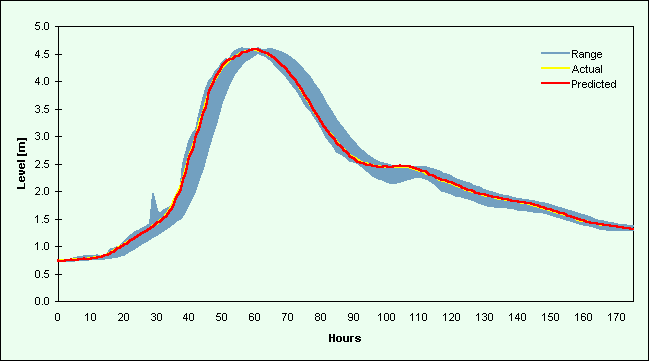
Figure 3d. Plot of a hydrograph for Skelton from the validation data set starting 29/03/92 19:00
In this paper two neural network data fusion strategies were implemented and tested using data from two contrasting catchments in the United Kingdom. Forecasts examined from the validation data sets confirmed that outputs from the data fusion implementations captured most aspects of the hydrograph. For Skelton on the River Ouse, both data fusion implementations outperformed the single source models and the two averaging methods. For the Upper River Wye, the use of differenced data was critical to the success of the method. The second data fusion implementation performed well on the 1986 flood data, but produced poor results in relation to the single models for the 1984 drought period. Although the initial results are promising, there is a need to gain further understanding of the forecasting capabilities of data fusion methodologies for hydrological modelling, and to resolve problems associated with peak flow prediction in flashier catchments, which will require the use of additional inputs such as past performance statistics. Data fusion offers a flexible approach of considerable potential for hydrological modelling. It may provide a set of useful operational tools for the enhancement of existing flood forecasting systems, although more rigorous and extensive testing is still required in both an operational and a research related context.
Abrahart, R.J. and L. See, [In prep.] Comparing Neural Network (NN) and AutoRegressive Moving Average (ARMA) Techniques for River Flow Forecasting. To be submitted to Water Resources Research.
Abrahart, R.J., L. See and P. Kneale, P., 1998. New tools for neurohydrologists: using 'network pruning' and 'model breeding' algorithms to discover optimum inputs and architectures. Proceedings of the Third International Conference on GeoComputation, University of Bristol, 17-19 September 1998.
Bathurst, J., 1986. Sensitivity analysis of the Systeme Hydrologique Européen for an upland catchment, Journal of Hydrology, 87, pp. 103-123.
Beven, K.J. and M.J. Kirkby, 1979. A physically-based, variable contributing model of basin hydrology, Hydrological Sciences Bulletin, 24, pp. 43-69.
Bishop, C.M. 1995. Neural Networks for Pattern Recognition. Clarendon Press, Oxford, England.
Box, G.E.P and G.M. Jenkins, 1976. Time series analysis: forecasting and control. Holden-Day, Oakland.
Dasarathy, B.V., 1994. Decision Fusion. IEEE Computer Society, Los Alamitos, CA.
Dasarathy, B. V., 1997. Sensor fusion potential exploitation - Innovative architechtures and illustrative applications. Proceedings of the IEEE, Vol. 85, pp. 24-38.
Eggers, M. and T. Khuon, 1989. Neural network data fusion for decision making. In: Proceedings of the 1989 Tri-Service Data Fusion Symposium, pp.104-118.
Foody, G.M. and D.S. Boyd, 1998. Mapping tropical forest biophysical properties from coarse spatial resolution satellite sensor data: applications of neural networks and data fusion. Proceedings of the Third International Conference on GeoComputation, University of Bristol,17-19 September 1998.
Hall, D.L., 1992. Mathematical Techniques in Multisensor Data Fusion. Artech House, Boston, MA
Hall, D.L. and J. Llinas, 1997. An introduction to multisensor data fusion. Proceedings of the IEEE, Vol. 85, pp. 6-23.
Jacobs, R.A., M.I. Jordan, S.J. Nowlan and G.E. Hinton, 1991. Adaptive mixtures of local experts, Neural Computation, 3, 1, pp. 79-87.
Kohonen, T., 1984. Self-Organization and Associative Memory, Springer-Verlag, Berlin, Germany.
Masters, T., 1995. Neural, Novel & Hybrid Algorithms for Time Series Prediction, John Wiley & Sons, New York, NY.
Perrone, M.P., 1994. General averaging results for convex optimization. In Mozer, M.C. et al., Eds. Proceedings of the 1993 Connectionist Models Summer School, pp. 364-371. Hillsdale NJ: Lawrence Erlbaum.
Perrone, M.P. and L.N. Cooper, 1993. When networks disagree: ensemble methods for hybrid neural networks. In Mamone, R.J., Ed., Artificial Neural Networks for Speech and Vision, pp. 126-142, London, England: Chapman & Hall.
Prieve, C. and D. Marchette, 1987. An application of neural networks to a data fusion problem. In: Proceedings of the 1987 Tri-Service Data Fusion Symposium, John Hopkins University, pp. 226-236.
Quinn, P. F. and K.J. Beven, 1993. Spatial and temporal predictions of soil moisture dynamics, runoff, variable source areas, and evapotranspiration for Plynlimon, Mid-Wales, Hydrological Processes, 7, pp. 425-448.
See, L. and S. Openshaw, [In press] Applying soft computing approaches to river level forecasting. To appear in Hydrological Sciences Journal.
See, L., R.J. Abrahart and S. Openshaw, 1998. An integrated neuro-fuzzy-statistical approach to hydrological modelling, Proceedings of the Third International Conference on GeoComputation, University of Bristol, 17-19 September 1998.
Widrow, B. and R. Winter, 1988. Neural nets for adaptive filtering and adaptive pattern recognition. IEEE Computer, Vol. 21-3, pp. 24-40.
Wilson, G.B., 1985. Some aspects of data fusion. In Proceedings of the IEEE Intelligence Conference on Advances in C3, April 1985, U.K., Publication 247.