G. F. Bonham-Carter and J. Broome
Geological Survey of Canada, 601 Booth St., Ottawa, Ontario K1A 0E8, Canada
Email: bonham-carter@gsc.nrcan.gc.ca / broome@gis.nrcan.gc.ca
Data models are essential for the effective capture, analysis
and distribution of geological maps and supporting data. Existing
and currently proposed data models need to be critiqued and improved,
to increase their acceptability by the geoscientific community.
Research on methods to generalize geological maps is needed. Integration
of geological map data with other map layers often requires transformation
of attributes of one set of spatial objects to another set. A
systematic review of such methods would be useful. In order to
represent geological knowledge, particularly in studies involving
multi-criteria decisions, guidelines for constructing fuzzy membership
and Dempster-Shafer belief functions are required. The Internet
has made a great impact on the distribution of geoscientific data.
Software already available for dynamic handling of spatial data
on the Web must be extended for dealing with the specific problems
of geological data.
Despite the many advances in geocomputation, it remains a disturbing fact that most geological maps in digital form are difficult to use effectively, particularly by non-specialists. There are several reasons for this: the main one is simply that the spatial objects portrayed on geological maps have complex attributes that do not lend themselves readily to universal classification. At present, spatial data models in geology are in their infancy, and no general standards for digital geological maps have been adopted, except at some local levels. Widespread use of data models is an essential prerequisite to facilitate the distribution and comprehension of useable geological information in digital form. A comprehensive data model must be flexible to accommodate the complex and variable nature of geological environments and the diversity of mapping techniques. The result is that suitable models will likely be highly structured, complicating both data input and extraction. In order to achieve general acceptance by the geological community and to persuade geological mappers to use a general standard, spatial data models must therefore be accompanied by algorithms and application software that facilitate database construction and application.
For non-geologists, use of highly structured map data requires interface software that can be customized for particular applications, and will shield the user from complexities that have no relevance to the applications. Environmental issues related to natural hazards, pollution and global change are some of the most pressing problems of our times. Although many environmental variables are affected directly or indirectly by geological processes, it is surprising how often geological factors are omitted from environmental studies. This is due, at least in part, to the lack of accessible geological data that can be understood by the non-specialist. Accordingly, the effective communication of geological knowledge using database and computational tools is important both for geological and environmental applications, and will encourage the use of geological data for other non-traditional uses.
This paper discusses the problem of dissemination and use of spatial geological data from the perspective of geocomputation research. We focus on geological maps, and avoid the extensive work on data models done in the petroleum industry (POSC, 1997; PPDM, 1997). The problem can be divided into three parts: (1) spatial data models, (2) computational problems associated with data use; and (3) distribution and data and interface tools. First, we begin with some introductory comments about geological maps and list of some typical applications of geological data.
The analogue map, and accompanying legend and report is the traditional form of geological database. Objects on the map are sometimes observed (e.g. structural observations and measurements at points), but frequently are inferred (e.g. boundaries of polygons). Map polygons are linked to a legend containing complex and diverse combinations of lithological and time-stratigraphic data and stratigraphic nomenclature. The map shows a 2-D view of a 3-D geometry. Fault lines on the map may form segments of the boundaries of polygons representing geological units, but not necessarily. The ensemble of geological objects reflects both temporal relationships linked to a complex earth history and lithological variations that are based on compositional variation.
The process of geological mapping has benefitted from many national
and international codes for standardization (e.g. North American
Commission on Stratigraphic Nomenclature, 1983). Nevertheless,
mapping practice differs between countries, between organizations,
and between individual scientists. A mapper will also modify
his or her mapping practice over time, as new ideas, theories
and practices evolve. Mapping is labor-intensive because bedrock
is often poorly exposed. Observed features and characteristics
are the result of a complex superposition of effects throughout
the geological history of the area. Although maps are based
in the first instance on ground observations, compilation of maps
at local scales (say 1:50 000) into regional scales (say 1:250
000) involves generalization, simplification and an understanding
of how each of the component maps were made, and what the units
on the maps represent. Further compilations to national and international
scales (1:1 000 000, 1:5 000 000 and so on) involve even more
generalization, and great skill and encyclopedic knowledge on
the part of the compiler.
Thus any systematic attempt to put geological data into a digital
database must deal with a mass of problems.
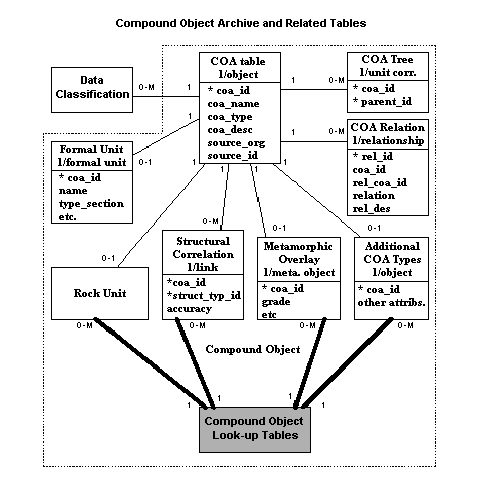
There have been many attempts to develop digital data models for geological maps, and this is not the place to review them in any detail. In general, recently published data models have been developed either mainly for dealing with already published maps (e.g. Colman-Sadd et al., 1997; Bain and Giles, 1997; Cara and Cryan, 1993; Ryburn and Blewett, 1993) or for field data capture (Brodaric and Fyon, 1988; Brodaric, 1997). The former type have concentrated on representing published cartographic documents, at the expense of detailed field observations used by the mapper in preparing an interpretation. The latter type have concentrated on observations made at field stations, and somewhat less on the cartographic objects on completed maps. Recent work to develop a comprehensive data model that attempts to serve all possible needs is under way in North America (Johnson et al. 1997, draft). The model in its present form is relational, although an object-oriented version is under development. Some idea of the complexity of the model can be appreciated from Figure 1, which shows an entity-relationship diagram of some of the tables in the group named "Compound Object Archive" or "COA". The idea of the COA is provide a means of defining groups of objects that possess either spatially or conceptually aggregated characteristics. This is complementary to a "Single Object Archive" (SOA), which consists of another group of tables that define map objects that are conceptually or spatially distinct. Clearly there are linkages between the SOA and COA tables. There are also other types of table, such as those dealing with legend items for example. The current version of the model contains over 40 tables, summarized in Table 1.
| Table | Group | Type |
|---|---|---|
| COA1 | COA | Descriptive |
| COA Relation | COA | Descriptive |
| COA Tree | COA | Descriptive |
| Formal unit | COA | Descriptive |
| Lithology | COA | Lookup |
| Lithology Tree | COA | Lookup |
| Metamorphic Overlay | COA | Descriptive |
| Radiometric Age | COA | Descriptive |
| Rock Composition | COA | Descriptive |
| Rock Unit | COA | Descriptive |
| Rock Unit Rank | COA | Lookup |
| Stratigraphic Age | COA | Lookup |
| Stratigraphic Rank | COA | Lookup |
| Stratigraphic Time Scale | COA | Lookup |
| Stratigraphic Tree | COA | Lookup |
| Structural Correlation | COA | Descriptive |
| Structural Type | COA | Lookup |
| Area Symbol | Legend Object | Lookup |
| Cartographic Object | Legend Object | Descriptive |
| Classification Object | Legend Object | Descriptive |
| Colour | Legend Object | Lookup |
| Line Symbol | Legend Object | Lookup |
| Point Symbol | Legend Object | Lookup |
| Data Classification | Legend/COA | Junction |
| Map | Metadata object | Descriptive |
| Map/Source Correlation | Metadata Object | Descriptive |
| Source | Metadata Object | Descriptive |
| Classification name | Metadata/Legend Object | Descriptive |
| Classification Scheme | Metadata/Legend Object | Descriptive |
| Fossil Detail | SOA2 | Descriptive |
| Spatial Object Composition | SOA | Descriptive |
| Spatial Object Name | SOA | Descriptive |
| Structural Detail | SOA | Descriptive |
| Geological Lines | SOA | Spatial Data |
| Geological Polygons | SOA | Spatial Data |
| Miscellaneous Lines | SOA | Spatial Data |
| Overlay Polygons | SOA | Spatial Data |
| Points | SOA | Spatial Data |
| Spatial Clasification | SOA/Legend Object | Junction |
|
Table 1: Summary of tables used in map data model of Johnston et al. (1997, table 3-1). Group indicates subset of related tables. Type indicates function served by table. Some tables contain descriptive data, some are lookup tables containing hierarchical word lists, and junction tables deal with many-to-many relationships. | ||
Even from this abbreviated description, it is clear that using such a data model will not be straightforward, unless good interface tools are developed. The worker adding to an existing database, or building a new one, needs user-friendly data-entry screens, tailored for the individual or institution, and organized to minimize technical jargon and redundant operations. To extract data for spatial analysis, there is a need for a simple request language, that can be translated automatically into SQL (or similar) commands. In this respect, the problem of building and extracting data from a comprehensive database for geological maps is similar to applications of many highly structured relational databases in other fields (e.g. automobile parts, insurance policies).
In order for comprehensive data models for maps to be accepted, in the first instance by geological mappers (notoriously individualistic), but also but all users of geoscientific data, it is essential that existing data models, and those currently being developed, be evaluated as widely as possible. Critical review by users of all kinds is, of course, essential for developing a consensus. The next stage is to address the analytical uses to which the data are to be put. How does someone interested in such problems as cadmium levels in wheat, or suitable locations for radioactive waste disposal, or the effects of acid rain on lakes, extract the relevant geological information from the database, and apply it effectively?
Although the digital analysis of geological data started at about the same time as other disciplines (widespread use in the early- to mid-60s), relatively little work has been done with geological maps. With the development of commercial GIS in the mid-80s, this situation has changed rapidly. Nevertheless, little attention has yet been paid to the basic operations needed to analyze geological map data, and to facilitate their use in multi-disciplinary GIS studies. Here we address the following seven topics related to geological map analysis. (1) Basic operations on the map database to extract and visualize specific themes. (2) Map generalization, to allow modification of attributes with changes in scale. (3) Linking objects (or classes of objects) to other databases, e.g. global tables of chemical and physical properties, to facilitate interpretation. (4) Transformations involving object structure. Transformations to estimate attributes from one object structure in another object structure. (5) Statistical analysis of spatial datasets. (6) Knowledge-driven analysis using knowledge-representation frameworks from expert systems. (7) Managing uncertainty in the analysis of geological maps.
Given the complexity of map data organized according to a comprehensive
data model, even simple operations to select and extract particular
information requires sophisticated SQL-type code. Most data users
require thematic maps, with simplified object and attribute structures
for interpretation, and do not have the skills or inclination
to write SQL. One solution is to apply general-purpose software
tools designed to interface with complex relational (and/or object-oriented)
databases, that provide ways to customize the front-end in the
language of the end user. There are several such products now
on the market. For example, one with mapping capability is from
Andyne Inc., which has MapInfo embedded for the mapping aspect.
Another solution is to maintain the basic data in an archived
database (full implementation of the data model), but also provide
simpler versions of the database in structures that are easy to
use with any of the popular GIS or desktop mapping packages. And
one can think of several other solutions.
Map generalization is a large subject that has been addressed in a number of different disciplines (e.g. Lagrange and Raus, 1995; Richardson, 1994). From a geologists viewpoint, simplification of the geometry of graphical objects is useful, but not particularly interesting. The type of generalization that is most pertinent to geology is the generalization of attributes, principally as a result of changes in scale.
Some kinds of generalization are relatively straightforward. For example, if a geological map has a complex set of rock types, and polygon attributes have been described in terms of the principal lithology and age, maps generalized by particular lithological and age conditions are straightforward to generate. Thus generating a new map showing only Devonian felsic intrusions should be a relatively simple SQL query, even using a complex relational structure (generalization as a result of selection). Also, generalizations involving changing from one level in a hierarchical classification to another level may be carried out without difficulty if the data model is clearly defined. Thus a generalization involving stratigraphic age, combining Epochs to give Periods for example, or changing from stratigraphic Formation to Series, or lumping individual rock types into sedimentary, igneous and metamorphic categories, should be easy to generate (moving from one level in a hierarch to another has been referred to as a form of universalization).
If however, the goal is to combine small polygons together into a reduced set of large polygons based on the relative proportions of rock types, then this can be more challenging. This is a type of generalization that involves some calculation. It requires that individual map units be defined by mixtures of rock types, and that the relative amount of each lithology is estimated, at least approximately. To illustrate this point, consider the data in Johnson et al's (1997) "Rock Composition table", simplified in Table 2. The records in this table define the attributes of individual rock types. Each rock type is linked to a "rock unit" (possibly many rock types per unit) and each rock unit in turn is linked to a polygon object on the map. The rock units have an identifying field, the coa-id (Common Object Archive id) field, see Table 2. Each rock type in the table is described with several fields, including ones that provide an estimate of the volume percent (percent) within the rock unit, and the quality (quality) of the volume percent estimate as a +/- value.
| Attributes | Definition | Format |
|---|---|---|
| coa_id | Unique identification number of a unit in the Compound Object Archive | Integer |
| comp_seq# | Unique identification number of a composition within a rock unit. also indicates the sequence number for displaying descriptive information about this composition within a rock unit description. Compositions are normally sequenced from most abundant to least abundant | Integer |
| lith_class | A lithologic classification term selected from those available in the Lithology Table (see below) | Character |
| rock_name | A free-text attribute for storing the map author's preferred name for the rock composition | Character |
| mineralogy | A mineral modifier associated with the rock name | Character |
| color | The color or colors of the composition | Character |
| texture | The texture of the composition | Character |
| alteration | A description of any alteration associated with the composition | Character |
| desc | A lithologic description defined by the map author which best describes this composition. This is intended to be read by people | Character |
| percent | An estimate of the volume percent of the composition within the rock unit | Integer |
| quality | Quality of the volume percent estimate (entered as ±nn%) | Character |
Table 2: Rock Composition Table (Johnson, 1997, table 2-33) | ||
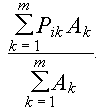
The one-many relationship between rock unit and rock type is essential for describing units with mixtures of lithologies. As the scale of the map decreases, say from 1:50 000 to 1:250 000, the larger more generalized rock units are likely to contain a greater diversity of rock types. Suppose that on a new regional-scale map a large polygon combines k=1,2,...,m small polygons, each with area Ak from a local-scale map. Further, assume that within the k-th small polygon the area percent of i=1,2,...,n rock types is given by Pik. Then the percentage of the i-th rock type in the generalized polygon will be a simple linear mixture equal to...
Of course, in order for this to hold true, the estimates of the percentages must sum to 100% for each polygon, and estimates are difficult to make. Polygon areas can be calculated automatically by a GIS. Conventional mapping practice has not included any formal estimation of percentages of rock types on map units. Most map legends simply list rock types in text form, with sequence in the list indicating, in general, relative abundance.
Given the necessary percentage data attached to objects on local-scale maps, then the estimates of the lithological composition of generalized units on regional-scale maps may be determined automatically. The basis for choosing which polygon boundaries to retain on regional scale maps could be made either automatically with age and/or lithological criteria, or by manual selection.
Unfortunately, published maps produced in the past have no quantitative estimates of relative lithological percentages. Published compilations of maps at regional scales have map units with long lists of rock types that are often too generalized for particular applications. Most map units described on 1:1 000 000 maps (and smaller scales) have long textual descriptions that are difficult to interpret for specialized map uses, without detailed local knowledge.
The type of generalization applies to other map features also, such as faults.
Applications of geological maps often require a knowledge of rock properties. The normal classification of rocks into rock types is on the basis of a combination of genetic, mineralogical, textural and chemical criteria. In order to use geological data for operations such as evaluating landslide potential, suitability for constructing a dam, or susceptibility to acid rain, it is necessary to know in more detail about the physical and chemical characteristics of the rock types present on the map than is simply conveyed by a rock name. One way of providing property information is to insert relational linkages from rock types to tables containing typical rock property data. For example, if the problem is to estimate weathering rates of trace metals from rocks, tables showing typical values of metal content, by rock type, are helpful. Similarly, geophysical modelling often requires parameter values for such properties as electrical conductivity, density, elastic moduli, (and many others), for interpreting surveys of various types.
Global property tables provide information that is often too general to be useful. In that situation, local data must be collected to provide customized property tables. Or the problem must be approached by finding suitable proxy information to constrain global estimates, and fill in data gaps. This is a topic which has received little attention to-date.
This leads to another computational topic that frequently recurs
in dealing with map data: the problem of transforming attribute
values from one set of spatial objects to another.
A typical GIS analysis of data from a geological map requires that attributes described for one type of spatial object must be transformed so that they can be used to characterize another set of spatial objects. The object types are usually point, line, polygon and grid-cell objects. Consider the well-known example of studying the chemical response of stream water (or sediment) to the local geology (e.g. Bonham-Carter et al., 1985; and other authors). This is a frequent problem for the analysis of regional geochemical surveys, either for environmental or mineral exploration purposes.
In this instance, the stream samples are point objects, but they are naturally associated with polygon objects--each polygon being part of a catchment basin, upstream from a sample site. The attributes of the points can be treated directly as attributes of the catchments. The catchments can in turn be used as objects to characterize the geology, surficial materials, vegetation, terrain type and other factors. The overlay of catchment polygons on the geological map allows the attributes of the geology polygons to be transferred (as area proportions for example) to the catchment polygons (or linked relationally). Vegetation and surficial-material polygons, and their associated properties, can be linked similarly. Terrain variables may transferred from a grid layer, aggregating the properties by catchment polygon. Point objects may need to be treated as counts (e.g. number of mineral occurrences, number of sinkholes), or their attributes transferred by interpolation methods (e.g. block kriging). Line objects may also be treated as counts (e.g.lineament density) or their attributes transferred to the polygon objects.
Such problems have been addressed in a variety of applications. In the geographical GIS literature, the Modifiable Areal Unit Problem (MAUP) (e.g. Flowerdew, 1991) seems to fall into this same general class.
Ultimately, many problems from GIS analysis of map data involve the overlay of multiple map layers, in either raster of vector data structures (or a combination), to produce a data table suitable for statistical analysis (see for example Bonham-Carter, 1994, ch.8). In raster, the entities (records) are grid-cells, and the attributes are values of map layers (or their attributes). In vector, the entities are the polygons produced by the overlay, and the attribute table is similar except that geometric attributes (particularly polygon areas) are added. In some situations, the polygon attribute table associated with an overlay can be greatly condensed by combining all records with the same attribute values (except area) into a "unique conditions" table, linked to "unique condition" polygons. Attribute tables that represent the characteristics all the spatial overlaps and their frequency in the data can then be analyzed in many different ways, using conventional software, such as statistical and neural network packages, or custom-developed code. Attributes for spatial location (and topology) may, or may not, be included in the analysis, depending on the method and the importance of local neighborhood factors to the modelling.
Much of the information on geological maps is recorded as attributes with defined on a categorical scale of measurement. Methods that allow the treatment of categorical data are therefore important, e.g. logistic models, weights of evidence, etc. Object layers with spatial coordinates in the attribute table are suitable for analysis by geostatistical methods for regionalized variables.
Analysis of multiple map layers for applications in resource appraisal and environmental impact analysis may involve Boolean operations to select areas that satisfy certain constraints. Evaluation of hypotheses that involve multicriteria decisions often use fuzzy logic and Dempster -Shafer belief theory as devices for knowledge representation. At present there is little guidance in the literature to help users of geological information express geological attributes in the metric of fuzzy membership or Dempster-Shafer belief functions, (e.g. An et al, 1994, Wright and Bonham-Carter, 1996, Bonham-Carter, 1994, ch.9).
One of the drawbacks to the use of geological map data in integrated
studies is the problem of handling uncertainty. Because geological
maps are based on samples at outcrops, much of what is portrayed
on geological maps is inferred, and uncertain. One of the advantages
of a systematic database approach to field mapping is the ability
to record field observations, as distinct from inferences made
to produce a "planar-enforced" map. The original field
data can be reinterpreted and the inferred data treated as one
of a large number of possible interpretations. There has been
little systematic work done on how to represent and deal with
uncertainty on geological maps in quantitative terms.
Many feel that the Internet will become the library of the future. If this is true, it follows that data not available through the Internet will be lost to the majority of users. To be accessible, the holdings of any library must be searchable which implies that the networked data must be described by metadata organized to support searches using common Internet search engines. At present, metadata describing geoscientific data are inconsistent, which is due both to lack of a widely-adopted metadata standard for geoscientific data, and incomplete.
Initiatives in several national geological surveys are addressing
this problem.
There continues to be improvements in network (Internet) access to the rapidly increasing volume of on-line geoscience data. Low-cost or free software is now available which encourages interoperability by allowing dynamic on-line access to distributed geospatial data stored in diverse formats and projections. Tools such as the Open Geospatial Data Interface (OGDI), as well as similar commercial products (e.g. FME), allow transparent access to a variety of geospatial and database structures with dynamic handling of variables for tasks such as simple generalization, and changes of format and projection. This capability allows users to avoid the conversion headaches traditionally associated with data input.
Methodology for graphical Internet access to distributed data is also being developed. A project at the British Columbia Geological Survey has demonstrated methodology that provides Internet access to a range of provincial geoscience data holdings. This initiative utilizes commercial Internet map-server and database-query software, customized to allow access, query, and visualization of distributed data through an easy-to-use graphical user interface
Many countries are endorsing the development of "spatial data infrastructures" that provide network access to interoperable data from diverse disciplines, including the geosciences. Rather than taking a hierarchical approach to construction, these initiatives should adopt a distributed and incremental approach with multiple access points which takes advantage of the power of the Internet.
Delivering geoscience data in a form customized to user requirements is an important challenge. Tools are required that allow user preferences to be identified by application and the type of data products to be generated. Ideally this process should be accomplished by "on-the-fly" data extraction. Although some tools to address this requirement for dynamic conversion are already available, customization is needed for geoscienctific data, compatible with geological data models.
An interim solution to the customization of data delivery would be the provision of "wizards" to guide users through the selection of appropriate tools to solve their specific interpretation and analysis problems.
We thank Boyan Brodaric for his constructive suggestions which improved this paper.
An, P., Moon, W. M. and BonhamCarter, G. F., 1994, Uncertainty management in integration of exploration data using the belief function: Nonrenewable Resources 3(1), 6071.
Bain, K.A. and Giles, J.R.A., 1997, A standard model for storage of geological map data. Computers & Geosciences 23(6), 613-620.
Bonham-Carter, G.F., 1994, Geographical Information Systems in the Geosciences: Modelling with GIS. Pergamon, Oxford. 398 pp.
Brodaric, B., 1997, Geological Field Data Capture and Manipulation using Fieldlog v3.0. Digital Mapping Techniques '97, Proceedings of a Workshop on Digital Mapping Techniques: Methods for Geologic Map Data Capture, Management and Publication; U.S. Geological Survey Open-File Report 97-269, p. 77-82.
Brodaric, B. and Fyon, J.A., 1988, OGS Fieldlog: A microcomputerbased methodology to store, process, and display maprelated data, Ontario Geological Survey Open File Report 570, p. 73.
Cara, P., and Cryan, S., 1993, Guide-book to the Digital Geological Map of Italy at the 1:50,000 Scale, Bollettino del Servizio Geologico d'Italia, vol. CX - 1991, Rome 1993, p. 23-90.
Colman-Sadd, S.P., Ash, J.S. and Nolan, L.W., 1997, GeoLegend: A database system for managing geological map units in a geographic information system. Computers & Geosciences 23(7), 715-724.
Flowerdew, R., 1991, Spatial data integration: In Geographical Information Systems, v.1 Principles, eds. Maguire, D.J., Goodchild, M.F. and Rhind, D.W., pp. 375387. Longman Scientific and Technical, London.
Johnson, B.R., Brodaric, B. and Raines, G.L., 1997, Digital geologic maps data model. Unpublished draft. 81 pp., available as http://ncgmp.usgs.gov/ngmdbproject/standards/datamodel/model41.pdf
Lagrange and Raus, 1995, Geographic Information Modelling: GIS and Generalisation; Proceedings of the Sixth Int. Symposium on Spatial Data Handling, Volume 2, Edinburgh, Sept. 1994, Waugh, T.C. and Healey, R.G. (eds.): Taylor and Francis, Bristol, PA, p. 1099-1117.
North American Commission on Stratigraphic Nomenclature, 1983, North American stratigraphic code. American Association of Petroleum Geologists Bulletin 67(5), 841-875.
POSC, 1997, Petrotechnical Open Software Corporation CD-ROM.
PPDM, 1997, Public Petroleum Data Model Association. http://www.ppdm.org.
Richardson, D.E., 1994, Generalization of spatial and thematic data using inheritence and classification and aggregation hierarchies. Proceedings of the Sixth Int. Symposium on Spatial Data Handling, Volume 2, Edinburgh, Sept. 1994, Waugh, T.C. and Healey, R.G. (eds.): Taylor and Francis, Bristol, PA, p. 957-972.
Ryburn, R.J., and Blewett, R.S., 1993, Users Guide to the NGMA Field Database: Australian Geological Survey Organization, Record 1993/49, 54 p.
Wright, D.F. and BonhamCarter, G.F., 1996, VMS favourability mapping with GISbased integration models, ChiselAnderson map area, Manitoba, In: EXTECH I: A multidisciplinary approach to massive sulphide research in the Rusty LakeSnow Lake greenstone belts:Eds. BonhamCarter, G.F., Galley, A.G., and Hall, G.E.M., (eds.),Geological Survey of Canada Bulletin 426, 339-376, 387-401.