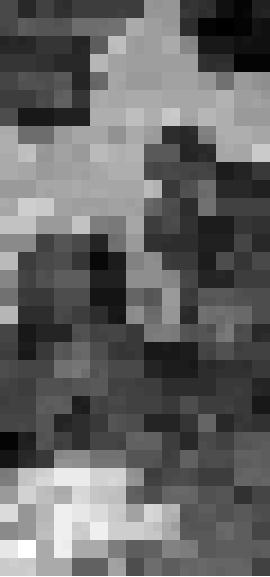
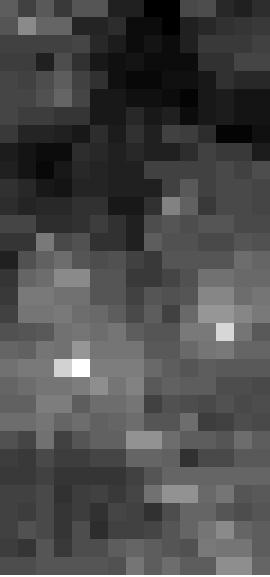
Figure 1. Extract of the NOAA AVHRR imagery in channel 2. For clarity all later figures show the same area.
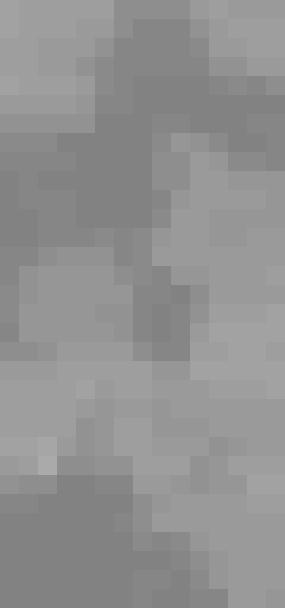
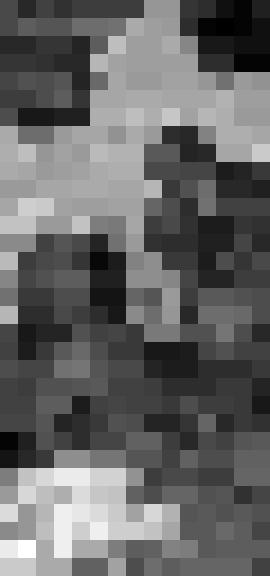
Figure 2. Examplar vegetation index image.
Giles M. Foody1 and Doreen S. Boyd2
1Department of Geography, University of Southampton, Highfield,
Southampton, SO17 1BJ, UK
and
2Centre for Earth and Environmental
Science Research, School of Geography, Kingston University, Penrhyn
Road, Kingston-upon-Thames, KT1 2EE, UK.
Email: g.m.foody@soton.ac.uk
Forest biophysical properties are typically estimated and mapped from remotely sensed data through the application of a vegetation index. This generally does not make full use of the information content of the remotely sensed data, using only the data acquired on a limited number of spectral wavebands, and may provide a relatively crude spatial representation. Using NOAA AVHRR imagery, it is shown that an artificial neural network may use all the remotely sensed data available to derive more accurate estimates of the biophysical properties of tropical forests in Ghana than a series of vegetation indices and that the representation derived can be refined by fusion with finer spatial resolution imagery.
Since forest ecosystems underpin many major Earth system processes, information on forest properties is fundamental in environmental science and management. The role of forests within the global carbon cycle is, for instance, uncertain as basic information on forest extent and biophysical properties are relatively poorly known (DeFries and Townshend, 1994; Curran et al., 1997). Remote sensing is the only feasible means of acquiring information on such variables at appropriate spatial and temporal scales. The acquisition of cloud- and haze- free optical remotely sensed data is, however, extremely difficult for many forest environments, notably the tropical and boreal forests, and radar data are often unavailable or inappropriate (Foody and Curran, 1994). As a consequence of its high temporal resolution the AVHRR sensor carried on the NOAA series of satellites has the highest probability of current optical remote sensing systems for the acquisition of data sets appropriate, in terms of spatial, spectral coverage, cost and data volume, for the study of forests (Roller and Colwell, 1986). Thus, data acquired by the AVHRR have become a major source of forest information. There are, however, a number of limitations to the accuracy of estimates of forest properties derived from such data. Focusing on tropical forests, for which there is considerable uncertainty (Mayaux et al., 1998), major problem areas are related to the methods used in estimating and mapping forest biophysical properties.
Typically forest biophysical properties are estimated using data acquired in visible and near-infrared wavelengths, often combined into a vegetation index (Peterson and Running, 1989). One of the most widely used vegetation indices is the Normalised Difference Vegetation Index (NDVI). For data acquired by the AVHRR, this may be derived from the detected response in channels 1 (visible) and 2 (near infrared) from,
(1)
and this index is generally positively related to measures of vegetation amount. The NDVI has become so popular that it is sometimes included in widely accessible data sets (e.g. Eidenshink, 1992; James and Kalluri, 1994; Smith et al., 1997). There are, however, problems in the use of this and other indices. Two key concerns are of importance here. First, the index is based solely on the remotely sensed response observed in a few spectral channels when the sensor that acquired the data typically operates in other, potentially useful, regions of the spectrum. The NDVI, for example, is calculated from the data acquired in just two channels, sampled from the visible and near-infrared parts of the electromagnetic spectrum, yet sensors such as the AVHRR acquire data in additional channels spanning other parts of the spectrum which could be used to obtain an index that is strongly related to the vegetation property of interest. The full information content of the remotely sensed data set is, therefore, not being used. Second, it has been well-established that vegetation indices vary in their sensitivity to vegetal properties between different environments and in relation to issues such as the type of vegetation and its ground coverage (Ringrose et al., 1994). These issues complicate the selection of an appropriate index for a study. Given the vast range of different types of index and the number of channel combinations that could be used in the calculation of a vegetation index there are numerous potential indices to be considered. Other means of combing the information content of the data acquired in the different channels may also be considered. Forest properties may, for example, be more accurately defined from a multiple regression analysis of the data acquired in the various spectral channels rather than from vegetation indices (Lawrence and Ripple, 1998).
Mapping the estimated biophysical properties is also limited by the coarse spatial resolution of the AVHRR sensor, 1.1 km at its finest spatial resolution. This limits the accurate characterisation of forest distribution and is, for example, a major source of error in deforestation estimates (Skole and Tucker, 1993; Downton, 1995).
In this paper, potential solutions to the problems of forest biophysical property estimation and mapping are considered using AVHRR and Landsat sensor data sets of tropical forests in west Africa that have been surveyed in the field. First, a feedforward neural network is used for estimating forest biophysical properties. With this approach, the data acquired in all channels may be used and no vegetation index need be specified as the network learns the underlying relationships prevalent in the data set under investigation. Second, the potential to 'sharpen' the derived map of forest properties is investigated. This focuses on the potential of current and near-future sensing systems (e.g. MODIS) that can provide imagery at dual spatial resolutions (Plummer et al., 1995). Due to the common trade-off between spectral and spatial resolution in sensor design, these imagery will vary in their information content on forest properties. The coarse spatial resolution image may have the spectral resolution necessary for accurate estimation of the forest biophysical properties but does not have the spatial detail of the fine spatial resolution image which in turn may lack the spectral resolution to estimate the forest properties. Fusing the two data sets, however, enables the analyst to utilise their respective information contents.
This study focused on tropical forests in south-west Ghana. For three forest reserves in this region, data on forest properties acquired from 29 permanent sample plots (PSPs) in 1990 were available (Foody and Curran, 1994). From each 1 ha PSP the density of trees with a diameter 10 cm was derived and used as ground data in the analyses of the remotely sensed data.
An AVHRR image of the test site that was relatively free from cloud and haze acquired in December 1990, close to the date of ground data acquisition, was used. As the forest biophysical properties were to be estimated using vegetation indices it would be inappropriate to use directly the image digital numbers (DN) and, therefore, the AVHRR data were radiometrically calibrated for the calculation of the vegetation indices (Guyot and Gu, 1994). The calibration was based on the published correction coefficients and constants appended to the image used (Di and Rundquist, 1994). The percentage reflectance in AVHRR channels 1 and 2 was derived with pre-launch calibration data from,
(2)
where Ri is the percentage reflectance in channel i, DN is the digital number extracted from the image and G and I are the slope and intercept coefficients (Kidwell, 1990). The data acquired in AVHRR channels 3 (middle-infrared), 4 (thermal-infrared) and 5 (thermal-infrared) were calibrated to brightness temperatures using,
(3)
where Ts is the surface brightness temperature (K), v is the central wave number of the channel filter (cm-1), C1 and C2 are constants, and E is the energy value (irradiance at the instrument aperture) which was derived from,
(4)
where c and d are constants extracted from the header of the AVHRR data set (Di and Rundquist, 1994). The accuracy with which temperature is estimated from AVHRR data may be degraded by a range of factors including non-linear errors associated with variations in the sensor's internal temperature and the effects of ageing on radiometer performance (Brown et al., 1985; Brown et al., 1993). Although the effect of latter factor is not known accurately compensation for the non-linear errors is possible and achieved here with the lookup tables of Weinreb et al. (1990). While the data acquired in AVHRR channel 3 may be usefully split into its reflected and emitted components (Boyd et al., 1998) the analyses were restricted to the data in the five calibrated AVHRR channels.
To investigate the potential of a sharpening image for refining the outputs of analyses of the AVHRR data a relatively fine spatial resolution image of the test site was also acquired. This was a Landsat TM image, with a spatial resolution of 30m, acquired in December 1986. Since the data acquired in one TM channel were to be used, and then only to refine the spatial representation of the AVHRR derived forest property estimates, these data were not radiometrically calibrated. The data in TM band 5 were selected and geometrically co-registered to the AVHRR imagery with an estimated error of <1km. The TM data were then spatially degraded by averaging over an 18x18 pixel window area to provide a data set with a spatial resolution approximately half that of the AVHRR data. In this way, 4 pixels in the degraded TM data occupied the area represented by a single AVHRR pixel, similar in nature to the relationships between fine and coarse spatial resolution channels in proposed satellite sensors (Plummer et al., 1995).
Conventional vegetation indices, such as the NDVI, were calculated to provide benchmarks against which the results of the neural network analyses could be evaluated. Using the radiometrically calibrated data acquired in the five channels of the AVHRR, a series of other indices were also derived. Using six styles of vegetation index calculation (Foody et al., 1996), a total, 115 vegetation indices that combine the data from two or more channels were derived. The indices varied from the basic and popular NDVI through to more complicated channel combination that have previously been demonstrated to be sensitive to tropical forest properties (Boyd et al., 1996; Foody et al., 1996).
A conventional feedforward neural network (Schalkoff, 1992) was used to estimate tree density from the data acquired in the five AVHRR channels. The neural network was, therefore, effectively used as an alternative to regression analysis for the prediction of tree density. The main advantages of the neural network approach over regression were that the often untenable assumptions in remote sensing applications, notably that the remotely sensed responses are linearly related to the biophysical variable, are not significantly inter-correlated and can be represented by normal distributions, are not made. Instead the neural network makes no assumptions about the nature of the data distributions or relations with the biophysical variable. Through an iterative learning process the network is trained to adapt itself until it can accurately predict the biophysical variable from the remotely sensed responses presented to it. The trained network may then be used to predict the biophysical variable across the remainder of the remotely sensed data set. Although this type of application of neural networks is relatively uncommon in remote sensing there are examples of its successful use in estimating vegetal properties (e.g. Smith, 1993; Baret, 1995; Boyd et al., 1997; Dawson et al., 1998).
The fundamental issues of neural network analyses are discussed widely in the literature (e.g. Schalkoff, 1992) and so not discussed here. It is, however, necessary to give some basic information on properties that can significantly influence the performance of a neural network. The architecture of the network used was selected subjectively on the basis of a series of trial runs. The network used comprised an input layer with 5 units (one for each AVHRR channel), two hidden layers each containing 7 units and an output layer with a single unit to represent tree density. A stochastic backpropagation algorithm was used in network learning. This algorithm was applied iteratively with the aim of adjusting the weighted connections between the network units until the network accurately predicted tree density from the AVHRR data presented to it in the training stage of the analysis. The weight up-date equation used the error calculated for a unit j to adjust the weight connecting it to the unit i in the previous layer, wij, whose output may be expressed as oi , on iteration n by,
(5)
in which h is the learning rate and a the momentum, which are usually defined on the basis of a series of trial runs. The aim was to construct a network that learnt the underlying relationships between the remotely sensed data and the biophysical variable adequately but which was not overtrained, so as to maintain a high generalisation power. Since network learning requires a training set of cases of known tree density, the data set relating to the PSPs was divided into training and testing sets. Of the 29 PSPs, 21 were used for training and the remaining 8 used as an independent testing set on which to evaluate the accuracy of the network based predictions of tree density. These data sets are smaller than desired but reflect the commonly encountered problem of obtaining high quality ground and remotely sensed data of comparable time period in the tropics (Curran and Foody, 1994). For comparative purposes, the same data sets were also used separately in the analyses based on the vegetation indices.
The end product of the application of the neural network and vegetation indices are a set of coarse spatial resolution images depicting tree density or, in the case of the vegetation indices, a surrogate for tree density. A variety of methods may be used to sharpen such coarse spatial resolution imagery (Munechika et al., 1993; Schowengerdt, 1997). If there is a strong correlation between the coarse spatial resolution representation of forest properties derived from a vegetation index or the neural network with a finer spatial resolution image, then a simple regression based approach may be used (Munechika et al., 1993). This uses the observed relationship,
(6)
where F is the vegetation index or predicted forest property from the neural network for a pixel derived from a coarse spatial resolution AVHRR pixel, av is the mean DN of the corresponding geographical area in the sharpening image and a and b are the derived regression coefficients. Once a and b have been defined, a fine spatial resolution estimate of F, F', may be derived using,
(7)
where Sf is the DN of a pixel in the fine spatial resolution sharpening image. Then, to ensure the area represented by each coarse spatial resolution pixel in the sharpened image has the same value as F, the final sharpened image value, F", takes the form,
(8)
where F'av is the mean value of the fine spatial resolution estimates of F in the area corresponding to a coarse spatial resolution pixel. Here, the spatially degraded Landsat TM data were used to sharpen the forest biophysical property estimates derived from the AVHRR data.
The 115 vegetation indices were applied to the AVHRR data relating to the PSPs. The degree of correlation between each vegetation index image derived and the ground data on tree density was assessed. From these analyses, it was apparent that the indices differed considerably in their sensitivity to variations in tree density. The widely used NDVI, for example, was only moderately, and oddly negatively, correlated with tree density (training set r= -0.49 and testing set r= -0.69) whereas indices using data acquired in other parts of the spectrum were the most strongly related to tree density. For example, the highest correlation coefficient was derived with the index (channel 4/(channel 2 + channel 5) and tree density for the training set (r=0.60) and so likely to be selected for application to the imagery in order to represent the forest tree density. Some stronger correlations were observed with the testing set, with the index (channel 1 * channel 3)/channel 5 yielding the highest coefficient of correlation with tree density (r=0.78). The significant variation in the correlation coefficients between the various vegetation indices and tree density highlighted the requirement to select a vegetation index with care. Once an index has been selected, the spatial distribution of tree density may be represented by the application of the index to the imagery. As an example, the (channel 4 - channel 3)/(channel 4 + channel 3) index, which was strongly related to tree density for the testing set) was applied to an extract of the AVHRR imagery (Figure 1) to yield a vegetation index image (Figure 2), which was strongly correlated with tree density in the testing set (r=-0.75).
|
|
Figure 1. Extract of the NOAA AVHRR imagery in channel 2. For clarity all later figures show the same area. | Figure 2. Examplar vegetation index image.
|
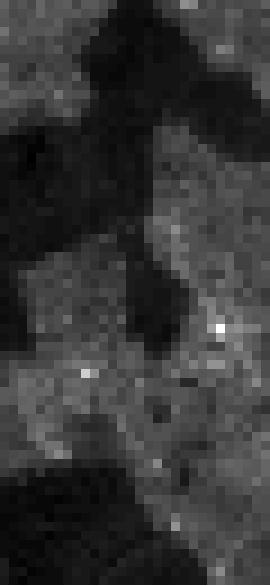
The selection of an appropriate neural network for the prediction of tree density from the AVHRR data is also a task requiring care. There are many network parameters that influence the accuracy of network learning and generalisation that require consideration (Foody, 1999). A variety of neural network parameter settings were investigated but attention focuses on the results from one, which gave strong relationships with tree density. In this network the parameters defining the learning rate and momentum were set at 0.8 and 0.2 respectively. Although the error in network learning was not minimised, training was terminated after 1500 iterations of the backpropagation algorithm as this provided a high accuracy of generalisation which was degraded by further training. This neural network, which may not be optimal, was used to predict the tree density of each AVHRR pixel and thereby derive a map of predicted tree density (Figure 3).
The accuracy of this was evaluated relative to the independent, but admittedly small, testing data set. It was evident that the tree density predicted from the neural network were more strongly correlated with the ground data on tree density (testing set r=0.91) than any of the vegetation indices. In relation to the NDVI, used as a standard benchmark, the degree of correlation with the ground data on tree density was significantly stronger. The neural network output also provided a representation that was visually superior to the vegetation indices.
Moreover, the output of the neural network analysis was a map of predicted tree density as opposed to a vegetation index which was only a surrogate for tree density. Lastly, it is worth noting that while the vegetation indices may be derived without the use of a training set, which is essential for the neural network, a training set is, in practice, required in order to identify the most appropriate index to apply to the remotely sensed data for predictive purposes.
The final analysis was to evaluate the potential of the sharpening image to refine the outputs from the analyses of the AVHRR imagery. Figures 5 and 6 show the neural network output and a vegetation index image that have been sharpened.
|
|
Figure 5. Sharpened neural network output. | Figure 6. Sharpened vegetation index image. |
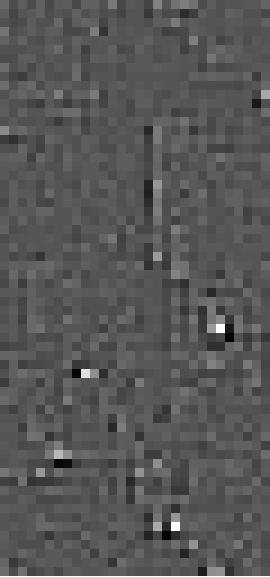
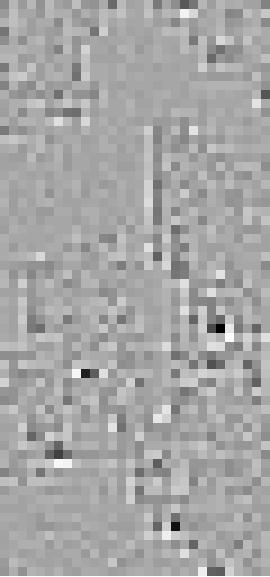
Visually, there was a slight improvement in the outputs, particularly in relation to the location of sites of apparent anthropogenic disturbance, which are most apparent on the images depicting the difference from the original neural network and vegetation index outputs (Figures 7 and 8). Although misregistration errors, even if substantially sub-pixel, and the only moderate correlation of the neural network output with the fine spatial resolution image (r=0.65), possibly a function of the time period between the image acquisitions, may have degraded the sharpening, the result nonetheless indicates that the dual spatial resolution functionality of some remote sensing systems may help to usefully refine the analyses.
|
|
Figure 7. Image depicting the difference between the original and sharpened neural network outputs. | Figure 8. Image depicting the difference between the original and sharpened vegetation index images. |
Remote sensing is the only practical source of information on forest properties at regional to global scales. To-date, the extraction of information on forest properties has been constrained by the spatial resolution of the data and under-utilisation of its spectral information content, particularly through a reliance on vegetation indices derived from a sample of the channels available. In this paper, it has been shown that the coarse spatial resolution estimates of forest properties may be refined with the aid of a sharpening image. More clearly, it demonstrated that the selection of a vegetation index for estimating forest biophysical properties is a difficult task. The popular NDVI, for instance, was only relatively weakly related to tree density whereas other indices using the information content of the remotely sensed data more fully were much more strongly related to vegetation amount. The neural network approach to the estimation of tree density, however, provided a direct prediction of tree density that was the most closely related to the ground data. By learning the underlying relationships between the AVHRR data and tree density the neural network could be used without any problems of channel or index type selection.
The data sets used were acquired through NERC TIGER contract 90/105 with the helpful assistance of the Chief Conservator of Forests, Ghana.
Baret, F.: Use of reflectance spectral variation to retrieve canopy biophysical characteristics. In: Advances in Environmental Remote Sensing, edited by F. M. Danson and S. E. Plummer, Wiley, Chichester (1995) 33-51.
Boyd, D. S., Foody, G. M. and Ripple, W. J.: Estimation of forest cover in Oregon, USA from NOAA AVHRR data: alternative approaches. In: RSS'97 - Observations and Interactions, Remote Sensing Society, Nottingham (1997) 405-409.
Boyd, D. S., Foody, G. M. and Curran, P. J.: The relationship between the biomass of Cameroonian tropical forests and radiation reflected in middle infrared wavelengths (3.0-5.0(m). International Journal of Remote Sensing (1998) (submitted).
Boyd, D. S., Foody, G. M., Curran, P. J., Lucas, R. M. and Honzak, M.: An assessment of radiance in Landsat TM middle and thermal infrared wavebands for the detection of tropical forest regeneration. International Journal of Remote Sensing, 17 (1996) 249-261.
Brown, J. W, Brown, O. B. and Evans, R. H.: Calibration of Advanced Very High Resolution Radiometer infrared channels: A new approach to non-linear correction. Journal of Geophysical Research, 98 (1993) 18257-18268.
Brown, O. B., Brown, J. W. and Evans, R. H.: Calibration of Advanced Very High Resolution Radiometer infrared observations. Journal of Geophysical Research, 90 (1985) 11667-11677.
Curran, P. J. and Foody, G. M.: The use of remote sensing to characterise the regenerative states of tropical forests. In: Environmental Remote Sensing from Regional to Global Scales, edited by G. M. Foody and P. J. Curran, Wiley, Chichester (1994) 44-83.
Curran, P. J., Foody, G. M., Lucas, R. M., Honzak, M. and Grace, J.: The carbon balance of tropical forest: from the local to regional scale. In: Scaling-up, edited by P. R. van Gardingen, G. M. Foody and P. J. Curran, Cambridge University Press, Cambridge (1997) 201-227.
Dawson, T. P., Curran, P. J. and Plummer, S. E.: The biochemical decomposition of slash pine needles from reflectance data using neural networks. International Journal of Remote Sensing, 19 (1998) 1433-1438.
DeFries, R. S. and Townshend, J. R. G.: Global land cover: comparison of ground-based data sets to classification with AVHRR data. In: Environmental Remote Sensing from Regional to Global Scales, edited by G. M. Foody and P. J. Curran, Wiley, Chichester (1994) 84-110.
Di, L. and Rundquist, D. C.: A one-step algorithm for correction and calibration of AVHRR level 1b data. Photogrammetric Engineering and Remote Sensing, 60 (1994) 165-171.
Downton, H. A.: Measuring tropical deforestation: development of methods. Environmental Conservation, 22 (1995) 229-240.
Eidenshink, J. C.: The 1990 conterminous US AVHRR data set. Photogrammetric Engineering and Remote Sensing, 58 (1992) 809-813.
Foody, G. M. and Curran, P. J.: Estimation of tropical forest extent and regenerative stage using remotely sensed data. Journal of Biogeography, 21 (1994) 223-244.
Foody, G. M., Boyd, D. S. and Curran, P. J.: Relations between tropical forest biophysical properties and data acquired in AVHRR channels 1-5. International Journal of Remote Sensing, 17 (1996) 1341-1355.
Guyot, G. and Gu, X-F.: Effect of radiometric correction on NDVI determined from SPOT-HRV and Landsat TM data. Remote Sensing of Environment, 49 (1994) 169-180.
James, M. E. and Kalluri, S. N. V.: The Pathfinder AVHRR land data set: An improved coarse resolution data set for terrestrial monitoring. International Journal of Remote Sensing, 15 (1994) 3347-3364.
Kidwell, K.B.: NOAA Polar Orbiter Data User's Guide, Department of Commerce, NOAA, NESDI, NCDC and the Satellite Data Service, Washington DC (1990).
Lawrence, R. L. and Ripple, W. J.: Comparisons among vegetation indices and bandwise regression in a highly disturbed, heterogeneous landscape: Mount St Helens, Washington. Remote Sensing of Environment, 64 (1998) 91-102.
Mayaux, P., Achard, F. and Malingreau, J-P.: Global tropical forest area measurements derived from coarse resolution satellite imagery: a comparison with other approaches. Environmental Conservation, 25 (1998) 37-52.
Munechika, C. K., Warnick, J. S., Salvaggio, C. and Schott, J. R.: Resolution enhancement of multispectral image data to improve classification accuracy, Photogrammetric Engineering and Remote Sensing, 59 (1993) 67-72.
Peterson, D. L. and Running, S. W.: Applications in forest science and management. In: Theory and Applications of Optical Remote Sensing, edited by G. Asrar, Wiley, New York (1989), 429-471.
Plummer , S. E., Danson, F. M and Wilson, A. K.: Advances in remote sensing technology. In: Advances in Environmental Remote Sensing, edited by F. M. Danson and S. E. Plummer, Wiley, Chichester (1995) 1-7.
Ringrose, S., Matheson, W., Matlala, C. J. S. S., O'Neill, T., and Werner, P. A.: Vegetation spectral reflectance along a north-south gradient in Northern Australia. Journal of Biogeography, 21 (1994) 33-47.
Roller, N. E. G., and Colwell, J. E.: Coarse-resolution satellite data for ecological surveys. BioScience, 36 (1986) 468-475.
Schowengerdt, R. A.: Remote Sensing. Models and Methods for Image Processing, second edition. Academic Press, San Diego (1997).
Schalkoff, R. J.: Pattern Recognition: Statistical, Structural and Neural Approaches. Wiley, New York (1992).
Skole, D. and Tucker, C.: Tropical deforestation and habitat fragmentation in the Amazon: satellite data from 1978-1988. Science, 260 (1993) 1905-1910.
Smith, J. A.: LAI inversion using a back-propagation neural network trained with a multiple scattering model. IEEE Transactions on Geoscience and Remote Sensing, 31 (1993) 1102-1106.
Smith, P. M., Kalluri, S. N. V., Prince, S. D. and DeFries, R.: The NOAA/NASA Pathfinder AVHRR 8-km land data set. Photogrammetric Engineering and Remote Sensing, 63 (1997) 12-32.
Weinreb, M. P., Hamilton, G., Brown, S., and Koczor, R. J.: Nonlinearity corrections in calibration of Advanced Very High Resolution Radiometer infrared channels. Journal of Geophysical Research, 95 (1990) 7381-7388.