|
1
|
- Garry Willgoose
- Earth and Biosphere Institute
- University of Leeds
|
|
2
|
- Walker, Rudiger, Grayson, Western: U. Melbourne
- Kalma, Hemikara, Hancock, Saco: U. Newcastle (Aust)
- Houser: NASA Hydrology
- Woods: NIWA, NZ
- Entekhabi: MIT
|
|
3
|
- How will emerging microwave remote sensing techniques for soil moisture
assist in estimating the hydrology of catchments
- ERS (early 90’s)
- AMSR (current)
- Hydros (planned)
- Can these techniques be integrated with new field instrumentation such
as TDR?
|
|
4
|
- To ground validate AMSR-E measurements
- To test data assimilation of SM using AMSR-E or surrogate
- To test data assimilation of SM using discharge data (in heavily
vegetated areas)
- To understand scaling properties of SM from Ha to 100km2 scale in
semi-arid
- To better understanding C, P balance in semi-arid catchments
- To understand floodplain as a temp storage for sediment from hillslope
to river.
|
|
5
|
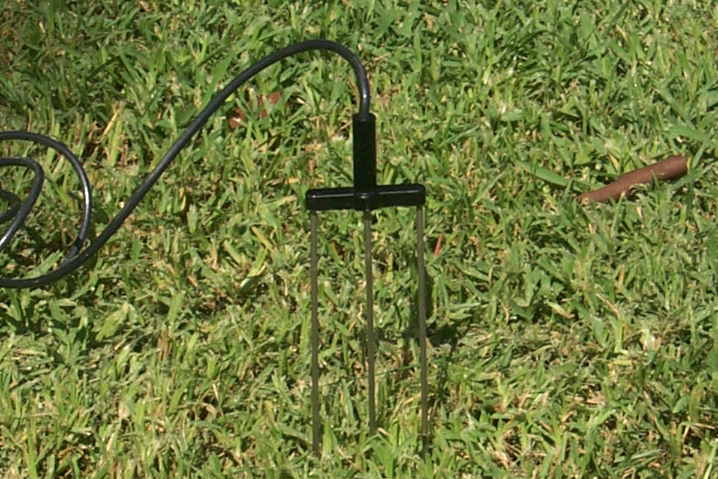
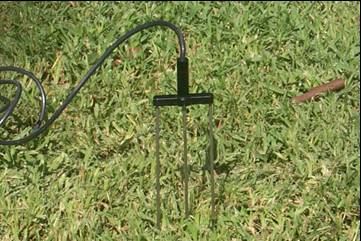
- Integrated depth measurement at a point
- Difficult to install near surface
- Poor in cracking soils
|
|
6
|
- Typical wavelengths see top few cms of soil water and canopy water,
impacted by soil surface condition (roughness).
- Repeat rate at best
- Radiometer: twice/day @ low space resolution (10-30 km)
- Radar: ~once month @ high resolution (20-30m)
- NOT measuring state of interest: whole profile soil water at catchment
scale=ET.
|
|
7
|
- “Frequent” measurements of surface soil moisture and model to simulate
profile.
- Potentially with sufficient soil data can remote sense soil depth and
water holding capacity.
|
|
8
|
|
|
9
|
- Dotted simulations (surface moisture DA) best track the long-term data
and the rise in May.
|
|
10
|
- Tarrawarra site (Grayson, Western, Willgoose, McMahon)
- Switch from arid (disorganised) to humid (organised).
- Is arid data disorganised or is it deterministically linked to spatially
random soils properties? Single probe calibration.
|
|
11
|
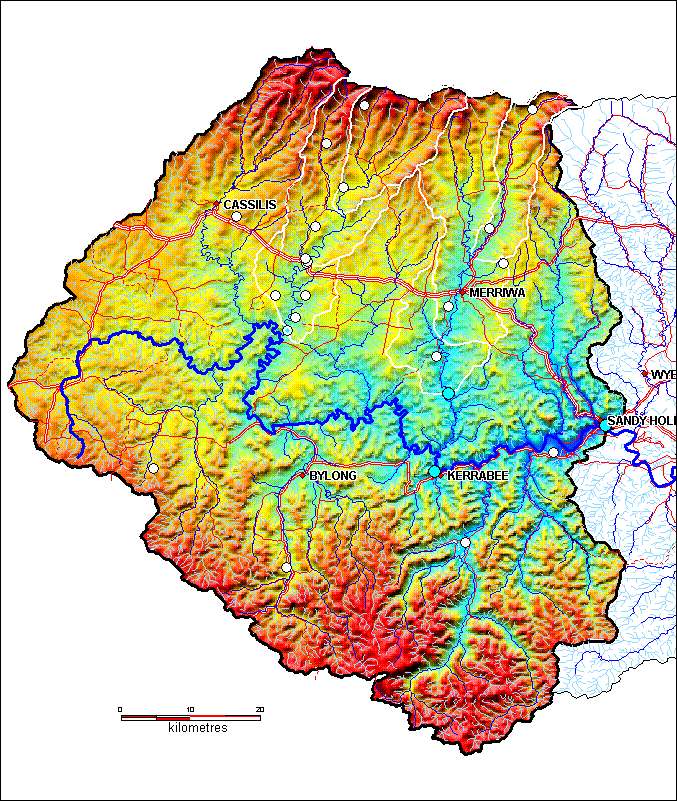
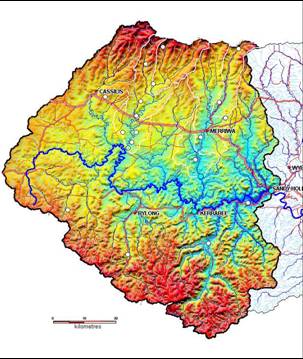
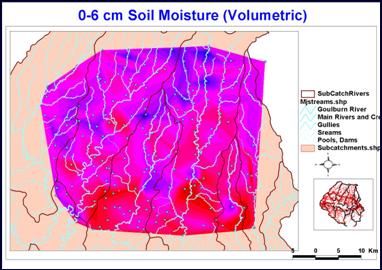
- 40 x 50km area
- North of Goulburn River within unforested region
- 4 teams over 3 days
- Sampled area about scale of AMSR pixel
- 225 soil moisture samples sites (4 gravimetric, 5 TDR),
- 194 veg samples
|
|
12
|
|
|
13
|
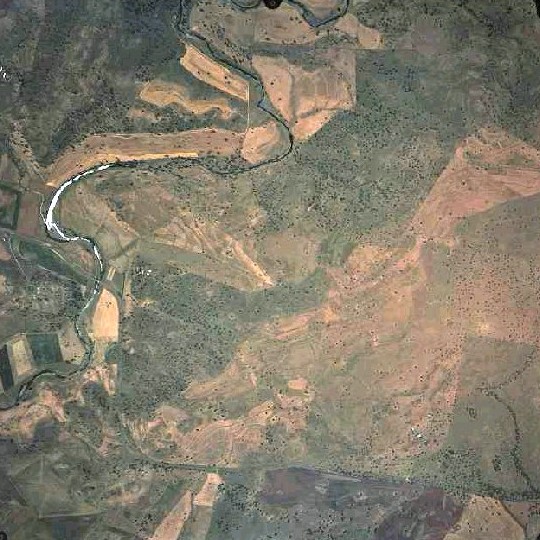
- 1km x 2km for look at hillslope organisation of soil moisture. Semi-arid
=> not topographic index … soils, veg?
- 7 permanent TDR sites, 1-3 levels in the soil
- Runoff gauging
|
|
14
|
- Strong response to rainfall and good correlation between depths.
|
|
15
|
- Good correlation over 2km
- Appears likely to be able to calibrate a single probe (i.e. difference
between sites due to permanent effects)
- Soil moisture correlations are parallel => soil moisture process is
vertical rather than a lateral topographic index type process
|
|
16
|
- Correlation of surface soil moistures not as good
- Cross correlation with deeper soil moistures also not as good
- Is +/- 10% accuracy good enough?
- Implications for remote sensing
- Soil moisture correlations definitely parallel
|
|
17
|
- Significant correlation scale of 0.2-0.5m. None up to 10m. Apparently
unrelated to vegetation patterns. Also unrelated to SM status. Soils?
- Implication: Hand held sampling is unrepeatable at the hillslope scale,
though fixed sites indicate significant spatial correlation at this
scale.
- More handheld sampling planned in March for the 10-1000m scale.
- If SM correlation can be used as surrogate for soil variability what
drives the soil variability? Implications for hydrology?
|
|
18
|
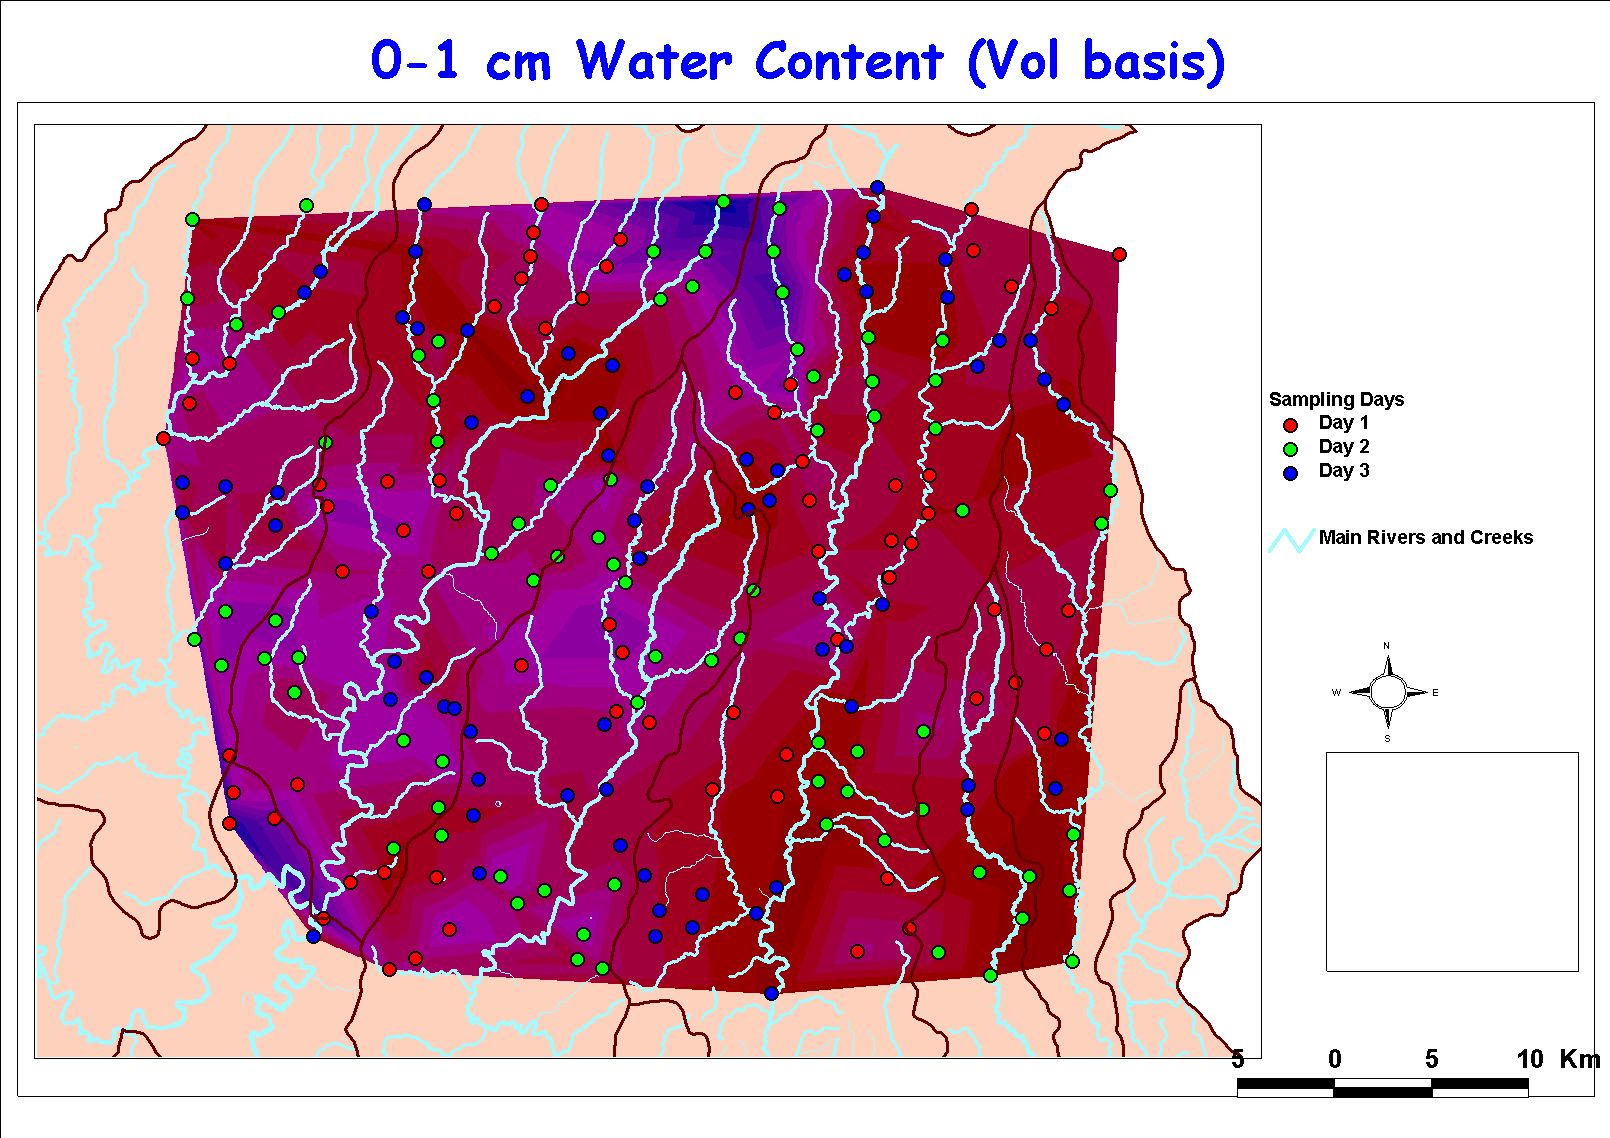
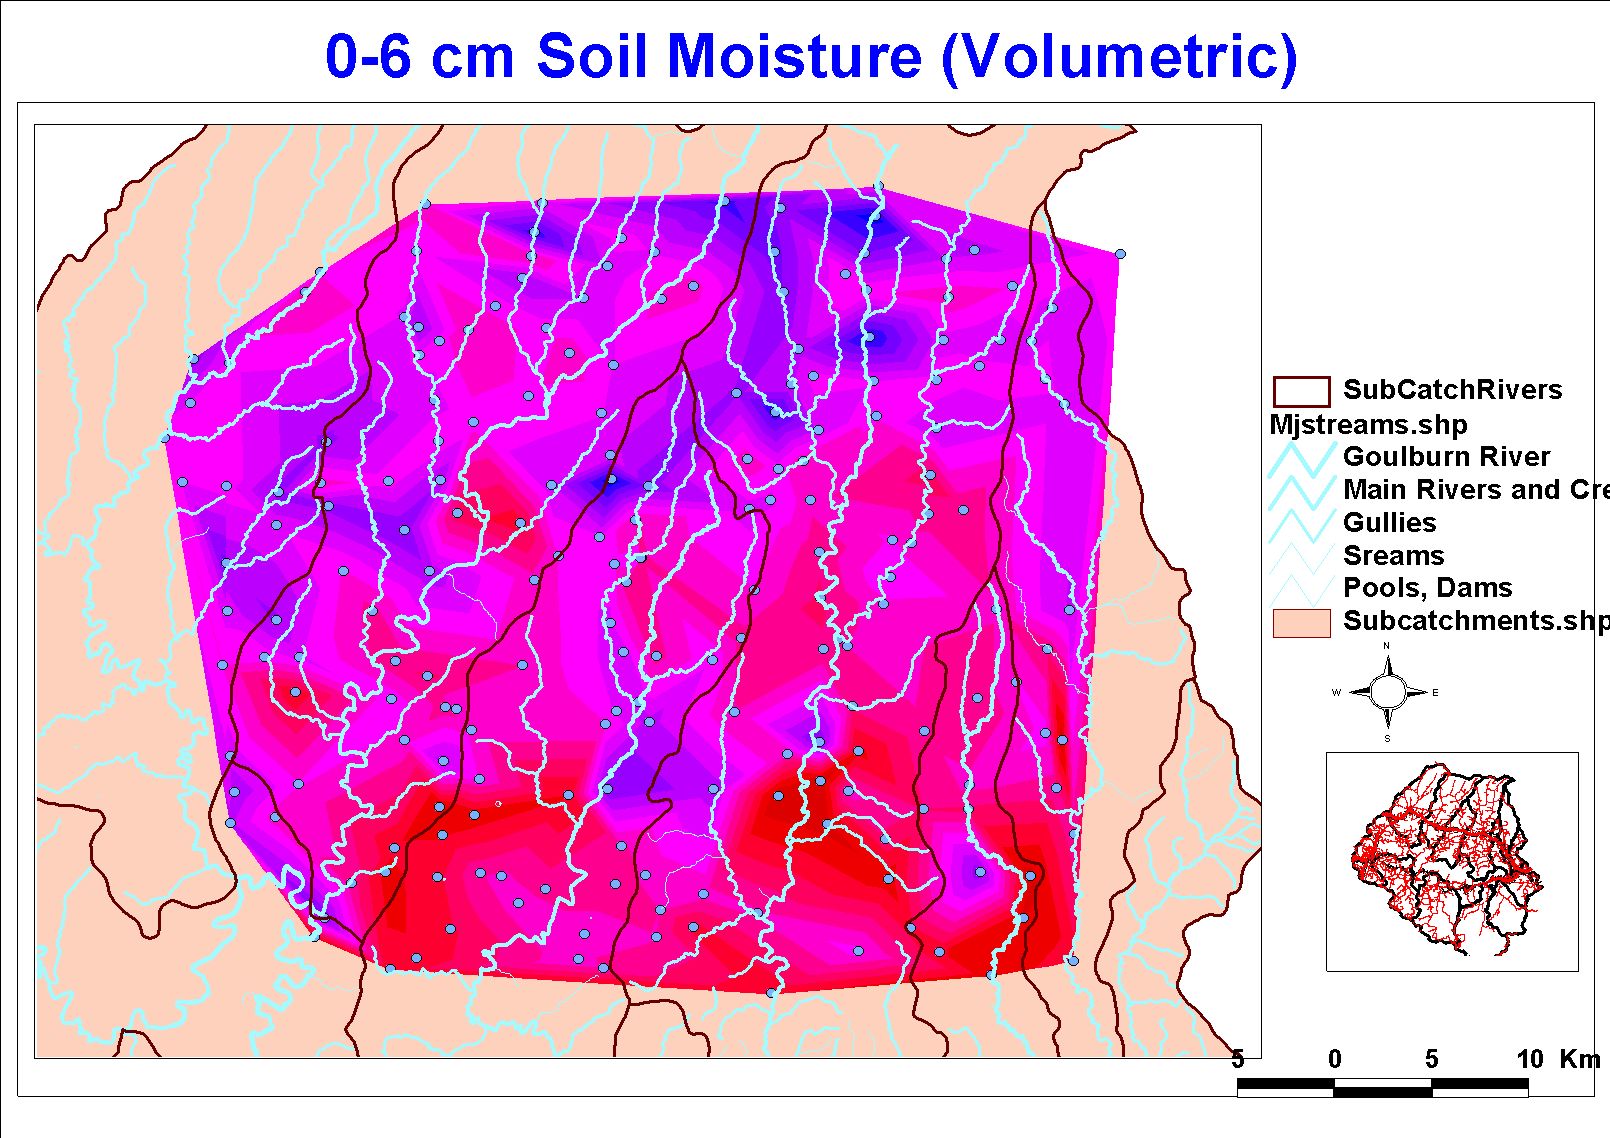
- There appears to be a nontrivial spatial correlation 1-3 km (from
surface soil moisture maps). Still processing recent SASMAS field
campaigns.
- This correlation appears to be consistent through time (from correlation
between permanent stations)
- We can assimilate profile soil moisture from surface measurements
(whether radar or TDR )
- Conclusion: The spatial correlation is a function of permanent
properties of the catchment (e.g. soil, vegetation) rather than
temporally uncorrelated fns such as rainfall.
- Implications: We can (in principle) predict catchment scale soil
moisture from single site TDR measurements (but short correlation scale
=> permanent sites required not hand held)
|
|
19
|
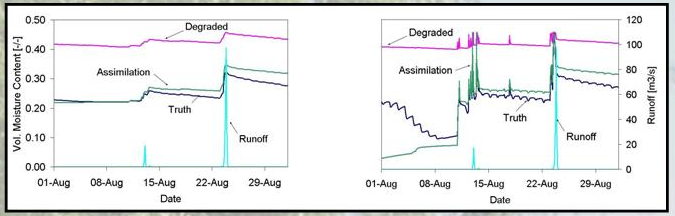
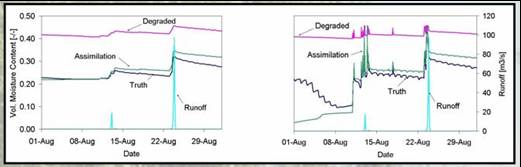
- Root zone soil moisture well assimilated
- Surface soil moisture also well simulated but more sensitive to noise
|
|
20
|
|
|
21
|
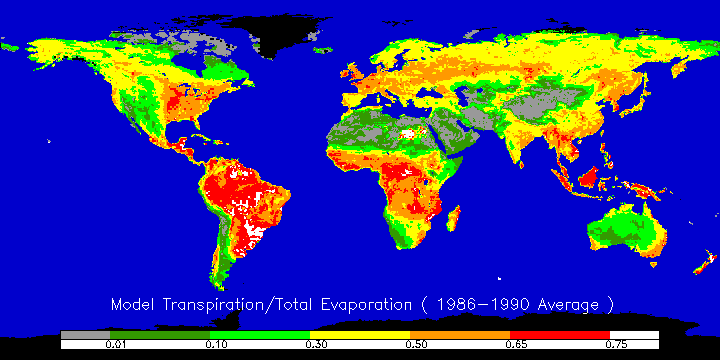
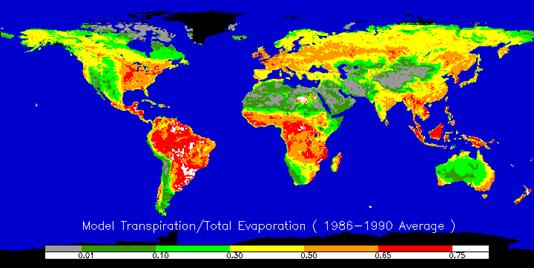
- Koster (NASA) showed that global climate dynamics/forecasts
(months-years) sensitive to soil moisture (through energy partitioning –
ET)
- Entekhabi (MIT) showed bimodal continental climates as a result of
rainfall feedback
- Eltahir (MIT) showed Sahel had three stable climate/vegetation states
due to feedbacks.
|
|
22
|
- Relative strength of ET to ocean moisture determines the local feedback
|
|
23
|
|
|
24
|
- Vegetation extracts from deeper layers so raw remote sensing will not
capture full behaviour … profile modelling necessary.
- TDR ground truth soil moisture … potentially calibratable to regional
averages.
- Potential for a network attached to meteorology stations.
|
|
25
|
- Point monitoring and telemetering of soil moisture now possible and
economic.
- Not easy to use upcoming RS data (concentrated on surface response).
- TDR point scale data appears to be regionalisable. Profile data would
complement surface imaging.
|

 Notes
Notes