You can use SPSS to reduce down your datasets using principal components analysis.
First, select the following menu item...
This will bring up the following dialog box...
This allows you to pick the variables you want to generate normality plots and statistics for. To pick variables, select them in the left side of the dialog box (example hightlighted red above), and click the arrow button in the middle of the dialog box to shift them into the "Variables" box. You can select several of your variables at once using the "shift" and "control (Ctrl)" keys. You can shift variables out of the "Variables" box using the reverse procedure.
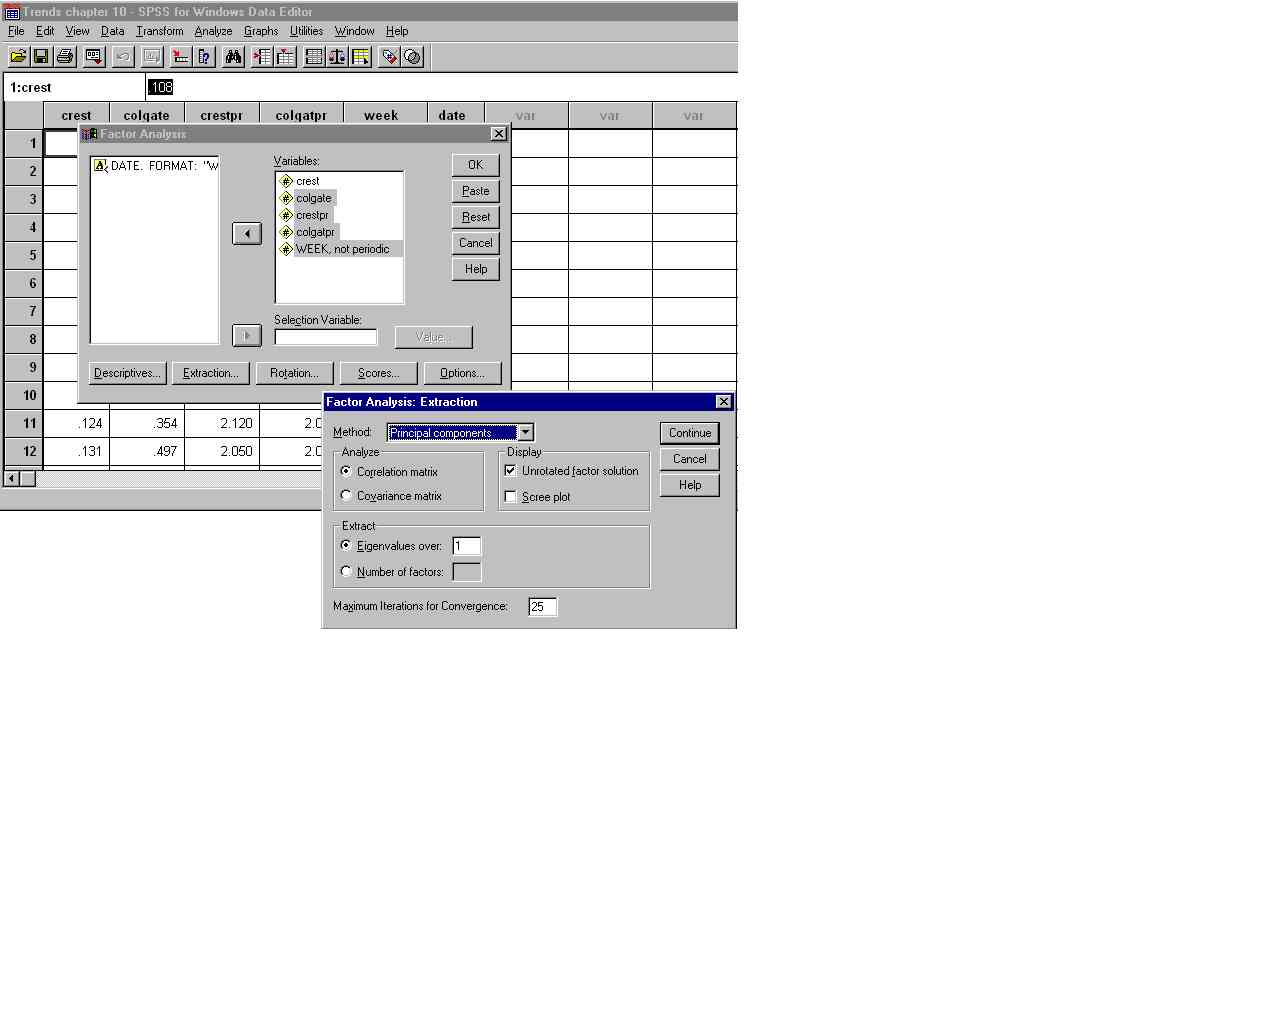
The next stage is to decide the type of extraction method required. To do this click on the base extraction method, as shown below this brings up a separate dialogue box. Select Principal components in the method pull-down menu. Select the required analysis, display and extract parameters. Click continue to proceed.
You are required to click on descriptives to select further analysis parameters, click continue to proceed.

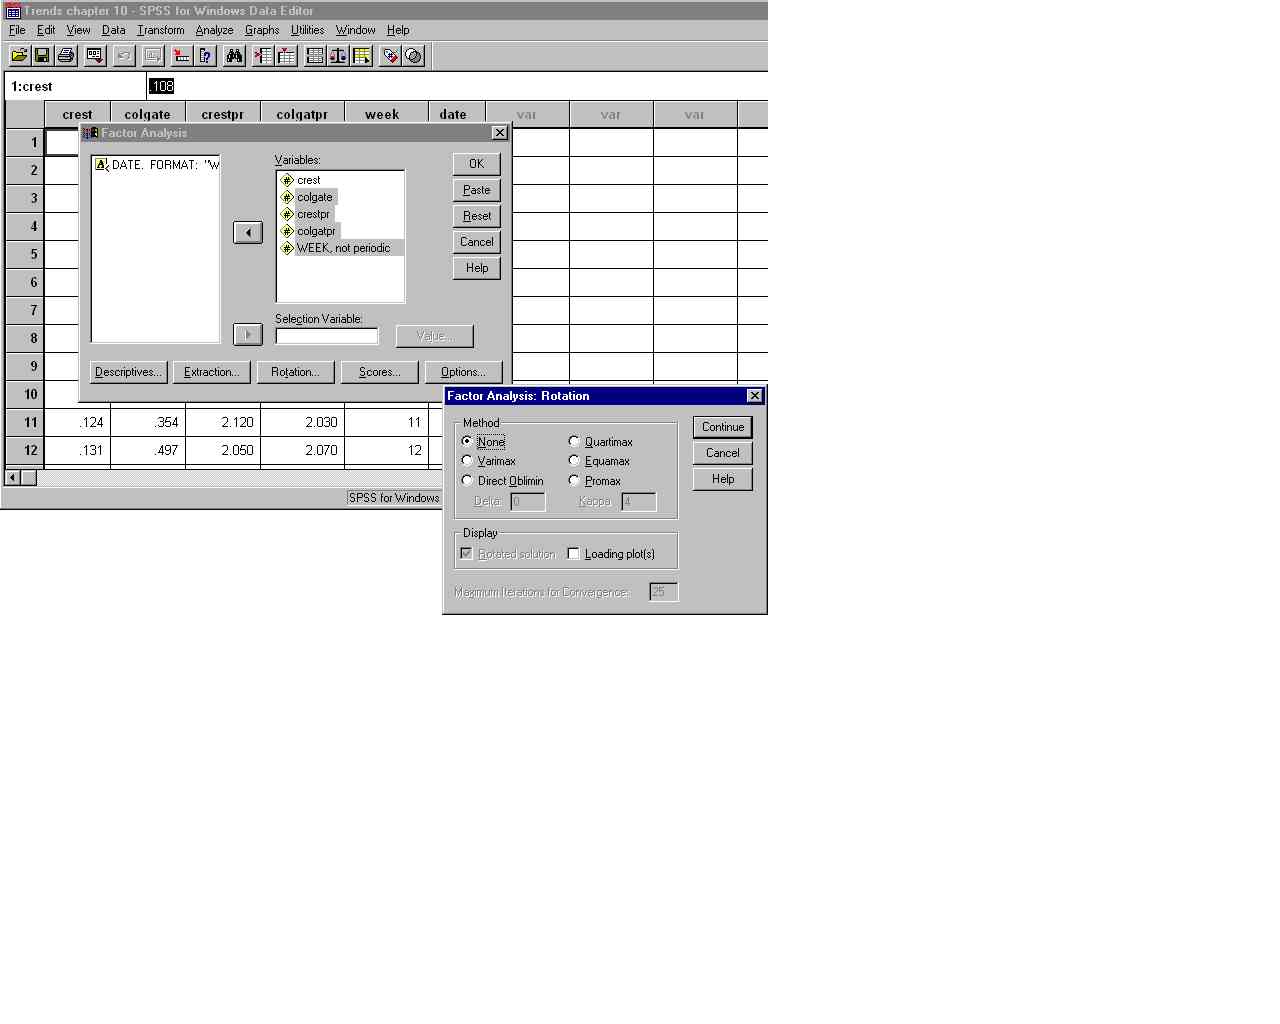
Click on rotation to select the desired rotation to aid in component interpretation. Click continue to proceed.
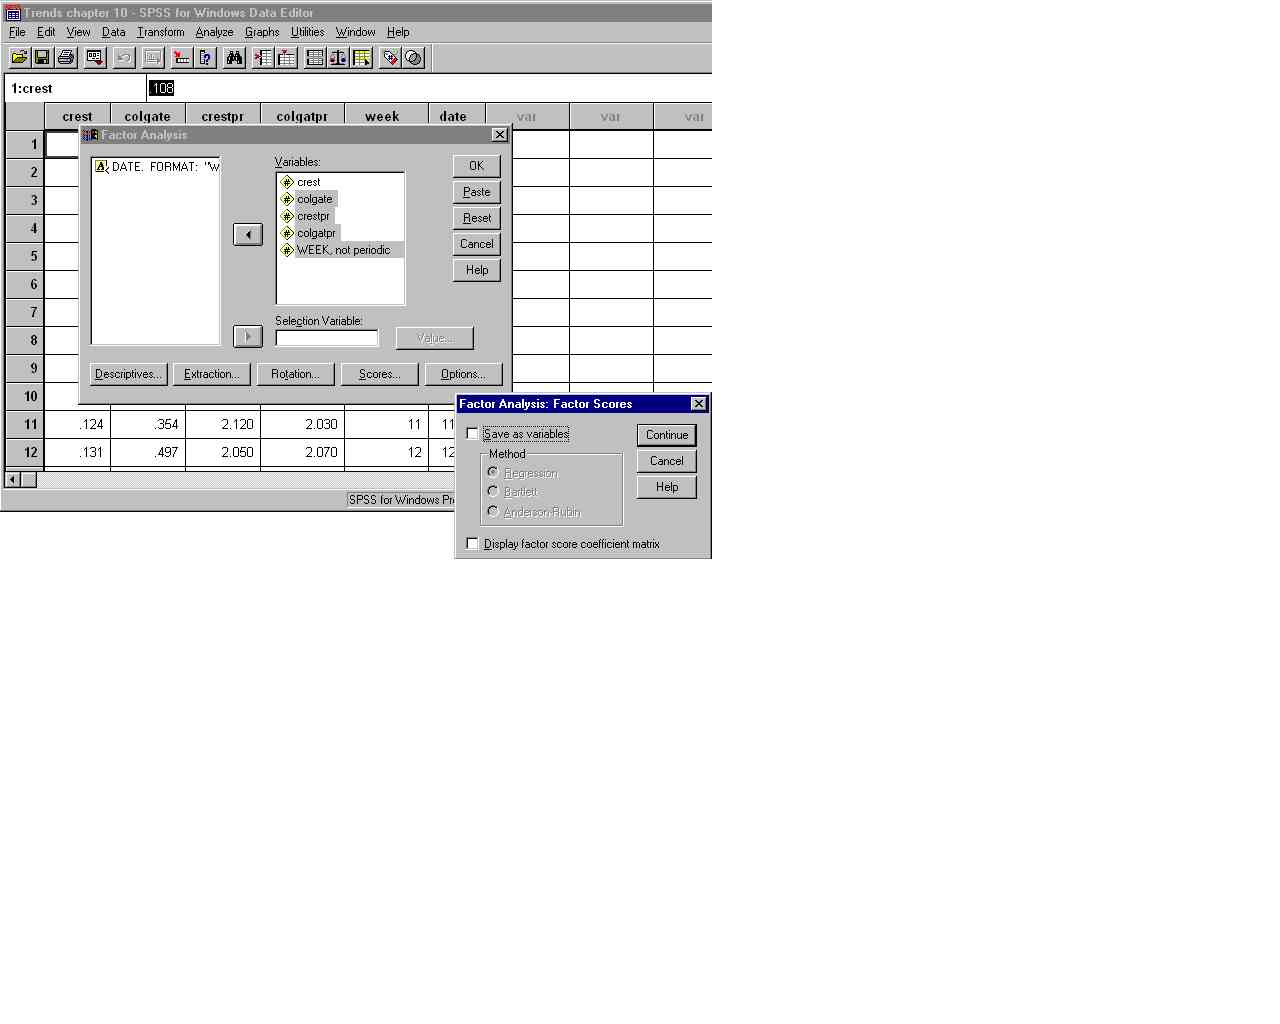
Select score method required. A factor score is a linear combination of the original variables. Click continue to proceed.
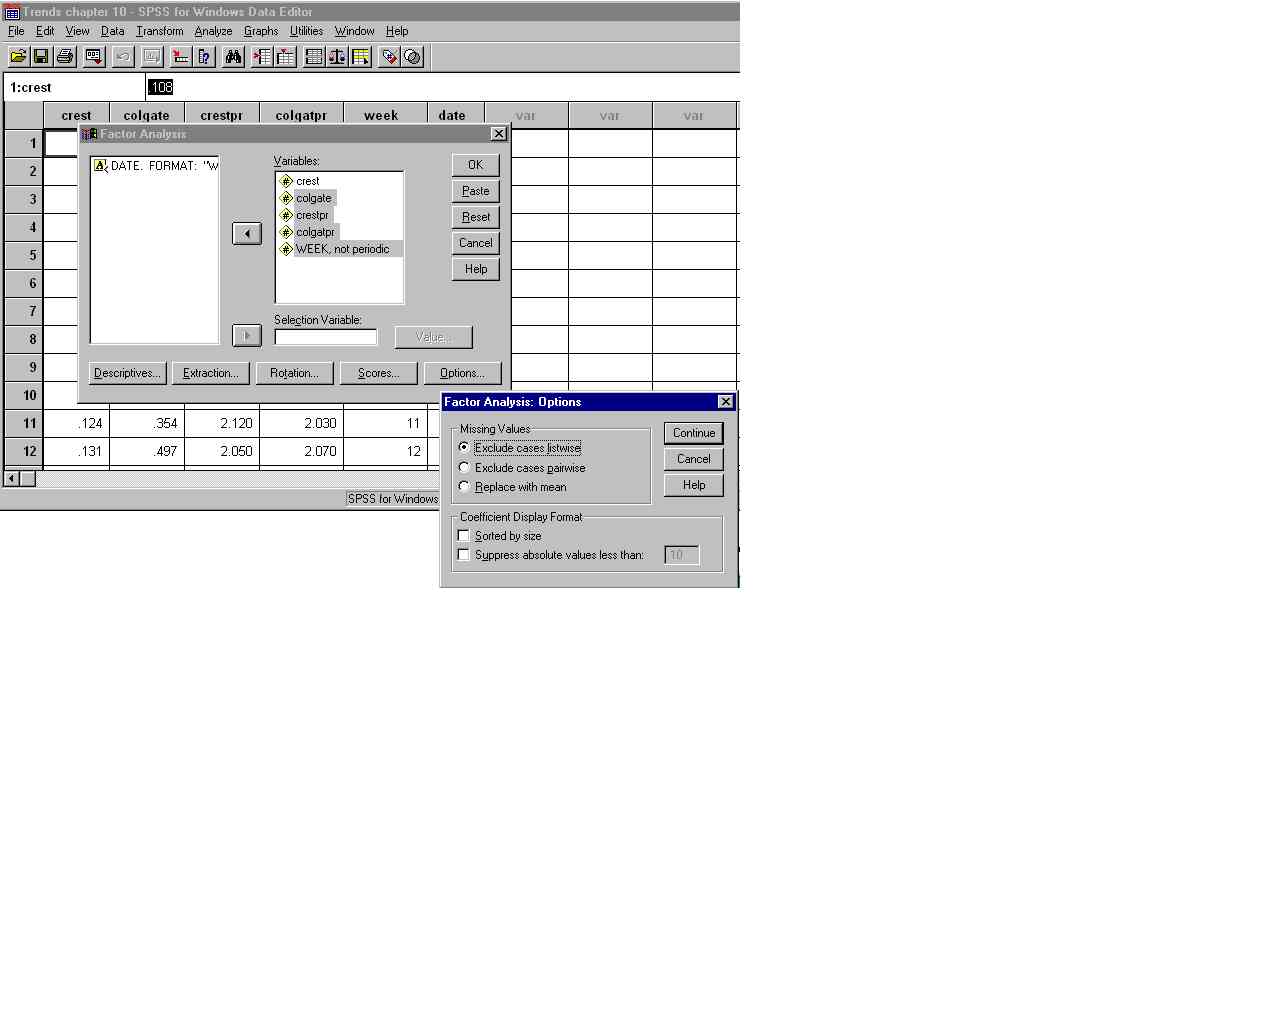
Click on options to further refine the analysis. Click continue to proceed.
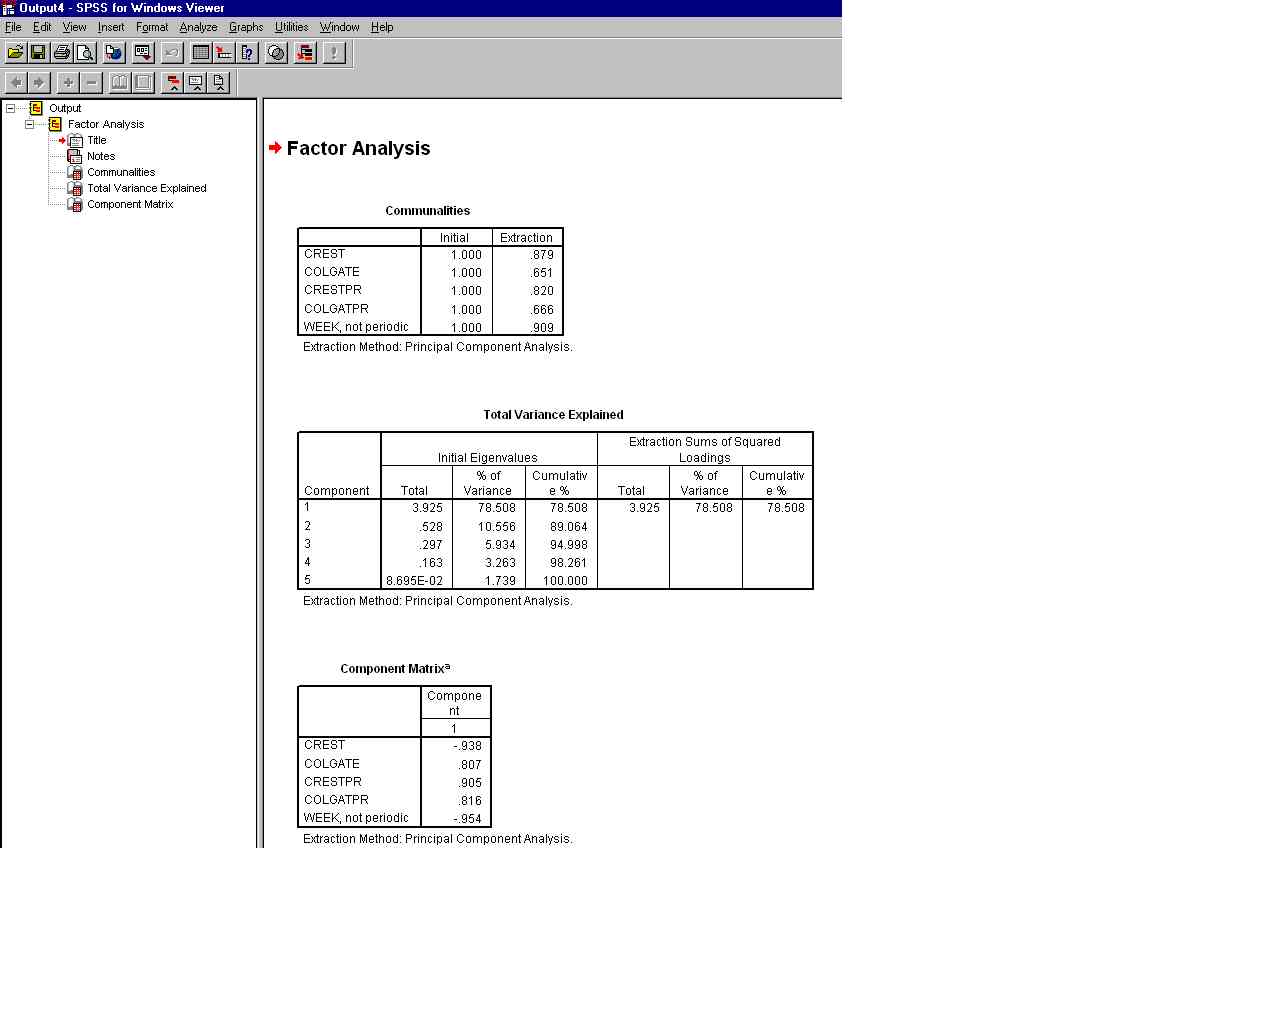
Click okay to initialize the analysis. This screen shot shows the output from the analysis. The total variance explained shows the total variance accounted for by each component.
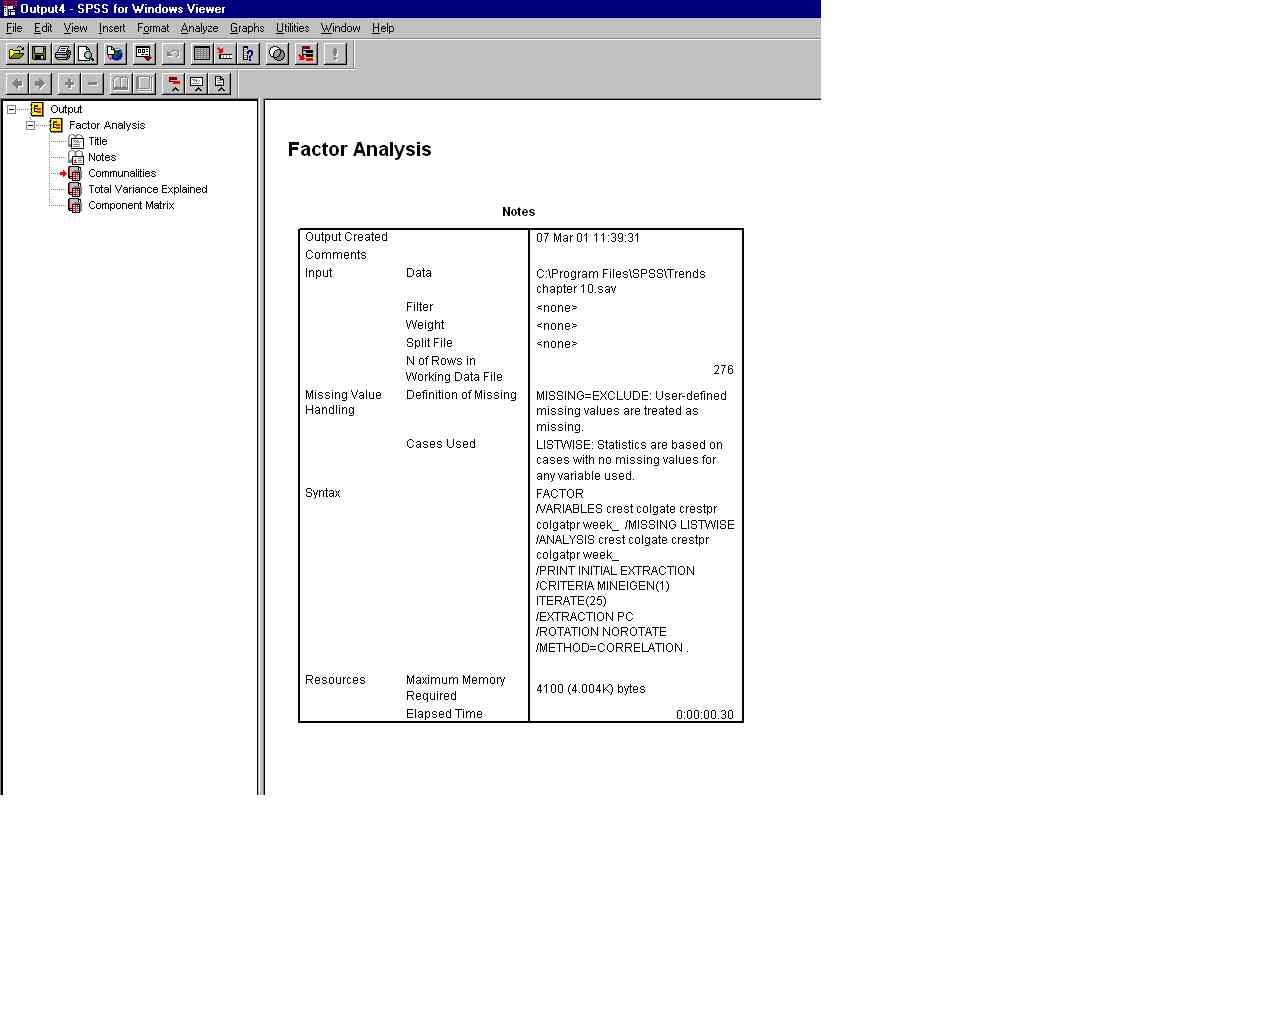
This shot shows a summary of SPSS commands that belong to this analysis.
For any further queries in regard to PCA, please don't ask us