Analysis: Visualisation
[Part 7 of 12]
Having covered some major aspects of data preparation: data in Arc, databases, and text-formats, we'll now move on to look at some areas of analysis that are useful for spatial problem solving. In this part we'll look at visualisation, and in the next part we'll look at maths, stats, and other analysis tools.
First up for visualisation, graphing data in Java.
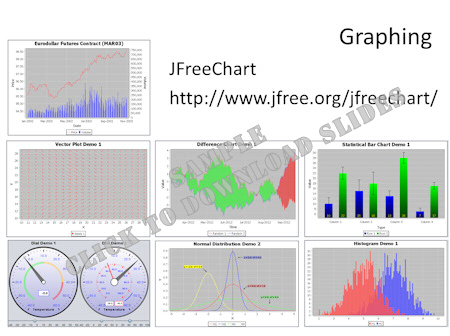
Graphing (powerpoint)
Further info:
JFreeChart
Javascript InfoVis Toolkit
D3.js Javascript library
Raphael Javascript library
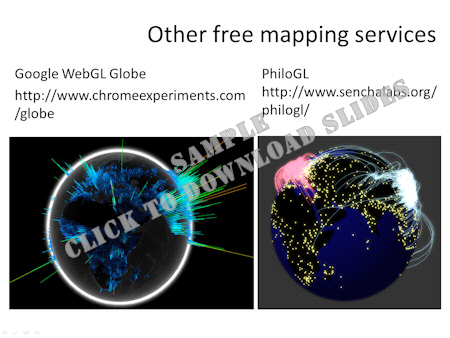
Next up, visualising geographical data outside of GIS.
Further info:
Keyhole Markup Language (KML):
standard and
documentation.
KML Test suite
Ballistic trajectories in KML (also)
Animations in KML
For a GoogleMaps example that uses a GeoRSS stream, see Full Examples page
GeoTools
GML and GeoTools
XML and GeoTools
(See org.geotools.gml in docs)
Cartograms:
WorldMapper
Cartogram Geoprocessing Tool
ScapeToad (source code)
Geographical data (powerpoint)
Finally, 'Processing' a powerful general visualisation language and environment based on Java.
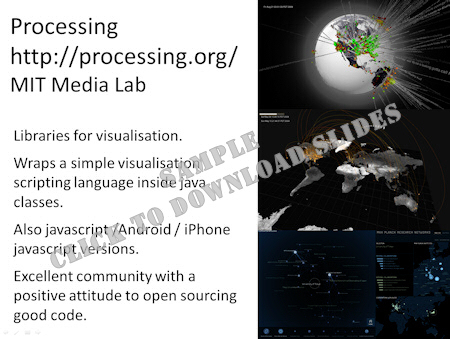
Processing (powerpoint)
Further info:
Processing homepage
Processing reserved variable names / keywords
Eclipse plugin
How to write processing within standard java
Nice tutorial on using Twitter with
Processing (cheers to ex-student Olly [who has done some nice work with twitter on the web using
processing.js])
MapThing Mapping library for Processing
City Uni's giCenter Processing utilities
giCenter's geoMapper
giCenter's handy