In part 1, we used the RTMDx software to identify the best model to capture the relationship between crime data and geographical features. The software will report the model, but we need to run the model ourselves using the input data (bus stops and detached houses in this case) to create a risk surface.
To begin with, we can look at the output from the RTM software. It will create an html file that can be viewed in a web browser. Look at these results for an example. The results explain which input variables were used and specify the most successful model. In this case, the risk associated with each raster cell is:
Exp(-3.3565 + 3.0617 * "bus stops" + 2.1578 * "det points") / Exp(-3.3565)
It appears that bus stops might have a relatively strong association with burglary. A cell that is within 500m of a bus stop has, on average, a 21 times greater risk of containing a burglary than a cell with a score of 1. Detached houses also suggest an increased risk, but this is not as pronounced as that for bus stops. In fact, while many burglars in the area do use public transport, this is more likely to be a result of bus routes following major roads.
There are many statistical or GIS software packages that could be used to apply the model above and create a risk surface. Here, we will use the R software package. If you are familiar with R, you can open the script and see how it works. Or if you are familiar with ArcGIS, the results provide instructions that explain how to use the Raster Calculator to create the risk surface.
Alternatively, you can just continue on to the following section. It is worth noting that the enterprise version of the RTM software will automatically generate a risk surface.
Using the R script above, it is possible to use the results of the RTM model to create a risk surface. The figure below presents the results.
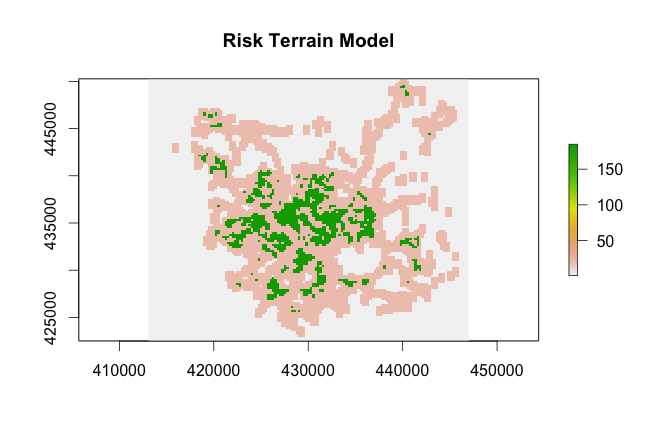
In this hypothetical example, it appears that the model has identified areas of high population density. Therefore it is clearly necessary to carefully re-evaluate the appropriate input risk factors. However, the examples has nonetheless demonstrated how to use the RTM software and use the outputs to generate a risk surface.