
Risk Terrain Modelling (RTM) - Practical 1 - Creating A Risk Terrain Model
Background
In this example, we will create a Risk Terrain Model for Leeds that explores the relationship between incidents of residential burglary and a selection of geographical and social features. There are certainly more useful selections of geographical data that could be related to residential burglary, such as the accessibility of roads, the presence of bars, the abundance of trees, etc. But the data chosen here are nevertheless appropriate for demonstrating the basic modelling process. The input layers that we will use are:
- Crime incidence data (the dependent variable in the model). These data are available free on the police.uk service, though we've downloaded and cleaned them, below.
- Detached houses - the number of detached houses in an area. Also measured from the census.
- Bus Stops: - the locations of bus stops in Leeds.
Note that the RTM software will only read point data, so the area-based data (households and detached houses) were generated by randomly creating the appropriate number of points in each area.
Obtaining the Software and Data
To begin with, it is necessary to download the RTM software. This software will read the input data files and run a series of regression models, exploring the interactions between geographic features and crime occurrences. It requires Microsoft Windows.
Go to the RTM download page and, if applicable, select the educational version. You will need to fill in some details to request a license. Once this process has been completed you will receive instructions for how to download and install the software. Note that you need to run the installer "As Administrator" (right-click the installer .exe file to select this), and you may need to allow R access through your local firewall software.
All the required data have been pre-prepared and can be downloaded from here. Once it has been downloaded, extract the zip file to reveal the individual data files (Leeds area, crimes, detached houses and bus stops).
Running the Model
As the data have been pre-prepared, running the model only requires opening the RTM software and selecting the appropriate parameters.
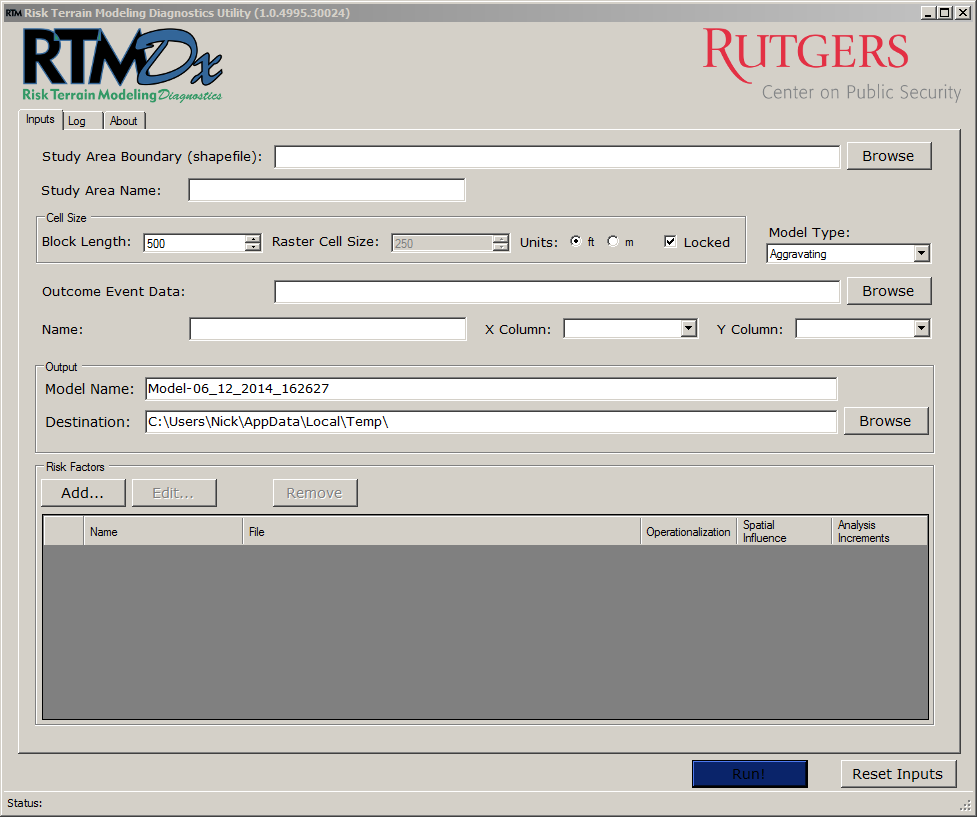
- Start the Risk Terrain Modelling Diagnostic Utility (RTMDx) software (right).
- For the Study Area Boundary choose the file leeds_district.shp. This is the district boundary for the Leeds area.
- In the Cell Size box choose a block length of 500 and choose meters (m) as the unit.
- In Outcome Event Data select the file leeds_burgd_2011.shp. This is the burglary data.
- In the Output section, choose a model name (if you want to) and select a folder in which to store the results of the model.
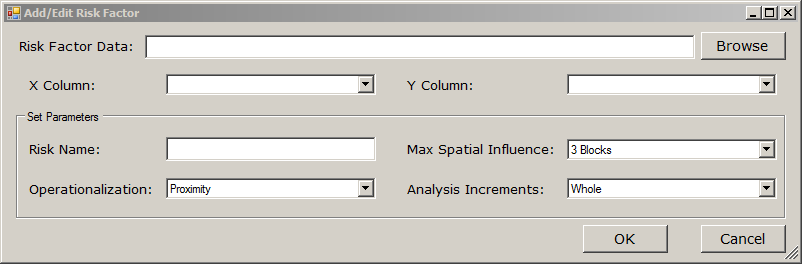
- Under Risk Factors, press Add. This will open a new window (right).
- Click on Browse and select the file det_points.shp (detached houses).
- Under Operationalisation select Density. This determines how the input risks will be included in the model. Proximity uses Euclidean distance and assumes that being close to particular features increases the likelihood of illegal behaviour. Density assumes that it is the concentration of features that related to crime risk, rather than the distance to the closest feature.
- Click on OK to confirm the choice of risk factor.
- Press Add again and add the bus stop data (bus-stops.shp). This time, select Proximity
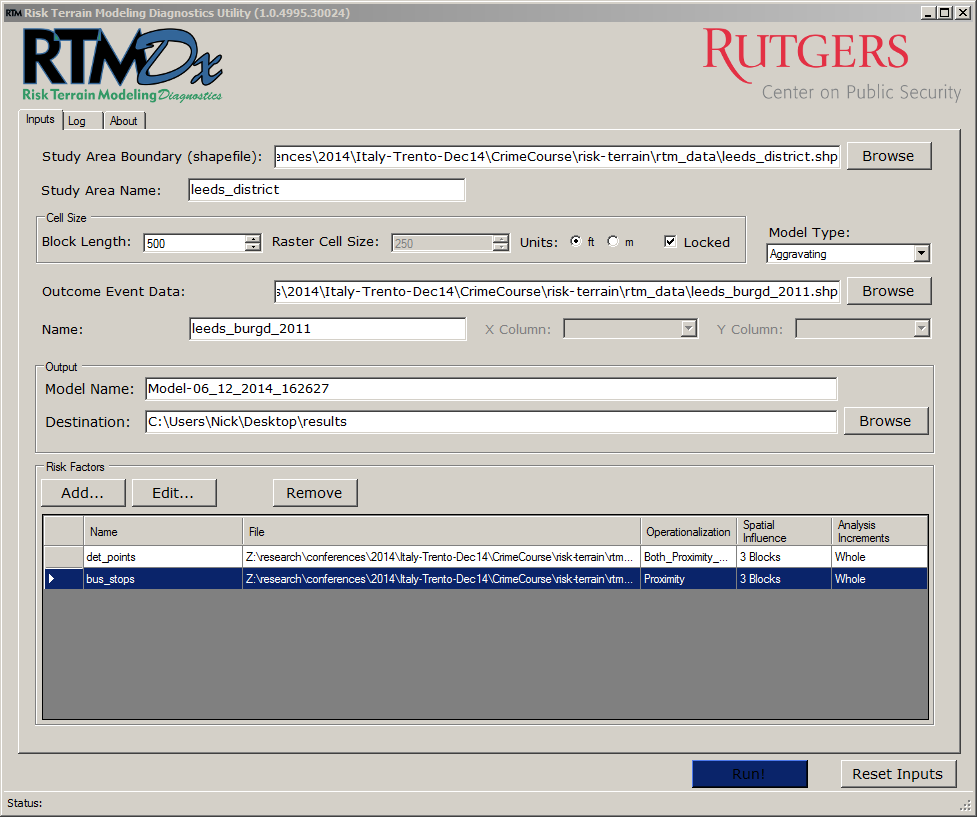
- Once everything is ready, click on Run to begin the model. This will take some time - you could go and make a cup of tea while you wait!
Now it is time to add the different risk factors (the detached houses and bus stops data)
Once the software has finished running, it will identify the best regression model and write out a full specification to the results folder that you specified earlier. The final stage is to take this specification and use it to create a risk surface. Continue to part 2 to do this.