
Near-repeat modelling: hands on
Summary: this tutorial works through the basic elements of a Trafford-style analysis, starting with an investigation of the scales inherent in a set of data, and then working through manually buffering crimes to create the appropriate predictive surface.
The first thing we'll do is look at the spatial and temporal scales inherent in the data, and see if it has any repeat or near-repeat patterns we can exploit for prediction. (see also the risk surface analysis, where we look at general spatial clustering in this data).
Download this data: robbery-randomised-short.csv. This is quasi-synthetic crime data that has similar statistical traits to real street robbery data in the UK.
The columns are Eastings, Northings, Date. The date is in European dd-mm-yyyy format; as the format has to match up with the system format the software is run on, if you run this
on a US date format machine, you'll need to convert the dates. We've limited the dataset to 9999 points as the software
we'll use seems to break with larger datasets; this is probably a memory issue, so if it breaks on your machine, try repeatedly deleting a thousand more points and trying again until it works.
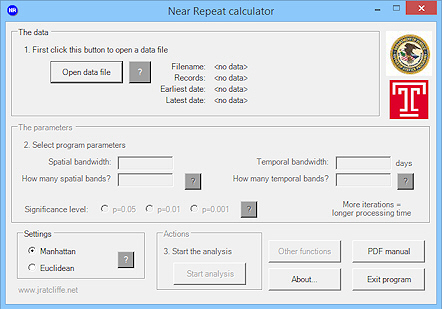
Download and install Jerry Ratcliffe's Near Repeat Calculator. This is a Windows application. If you are on a Mac or Linux laptop, you will
need to use something like Wine Bottler or a Virtual Machine. Now go to the install directory, and open up the application: NearRepeats.exe. You should see something like this:
In the install directory, you should also find a pdf: NearRepeatsManual.pdf. Open this up and read it through. It gives a clear explanation of the methodology
developed by Johnson et al. (2007) from the work of Knox (1964).
Run the data file through the software; we'd recommend starting with 100m x 20 and 7 days x 10 for the main settings. The software will generate a webpage of results in the data directory, and try to open it using your default browser. Using this information, decide on what would be the optimum window for creating buffers. Although significance values are given by the software, and are useful in this respect, ultimately this is, to a degree, a value judgement (albeit one we can validate later). Ideally you want to pick a distance and time that distingishes the near-repeat patterns from the background patterns. Given this, you might, for example, take statistical significance as important in this regard, though it is probably too rigorous a limitation at the 95% level. Alternatively you might take the drop down to a Knox ratio of 1 as indicative of the background pattern. Either way, two issues arise:
- the background average will be determined by the size of the area studied and its characteristics (for example repeat-offenses may be harder to determine in an general long-term crime hotspot than a low-crime area) and
- the larger the area, the harder areas will be to patrol.
As such, the subject needs some close thought and discussion with practitions on patrols etc. before a decision is made. Although you can use the data to derive both spatial and temporal scales, we won't deal with the temporal aspect here, instead taking the Trafford method's three week maps for simplicity's sake – though the addition of more colours to the process for circles is not a difficult one.
Once you have your key spatial scale worked out, we can move on to part two: making the predictive map. Here we work with the Fielding and Jones (2012) methodology, which builds on the work of Bowers et al. (2004).
On to PART TWO.
References
Bowers, K.J., Johnson, S.D., and Pease, K. (2004) Prospective Hot-spoting: The Future of Crime Mapping? The British Journal of Criminology, 44, 641-658.
Fielding, M. and V.Jones (2012a) 'Disrupting the optimal forager’: predictive risk mapping and domestic burglary reduction in Trafford, Greater Manchester International Journal of Police Science & Management, 14 (1), 30–41
Fielding, M. and V.Jones (2012b) Repeat Victimisation – Road to Reduction Project summary for European Crime Prevention Network
Knox, G. (1964) Epidemiology of Childhood Leukaemia in Northumberland and Durham. British Journal of Preventative and Social Medicine, 18, 17-24.
Johnson, S. D., D.J. Birks, L. McLaughlin, K.J. Bowers, & K.Pease (2007) Prospective crime mapping inoperational context: Final report, Home Office Online Report 19/07.
Ratcliffe, J.H., (2009) Near Repeat Calculator (version 1.3). Temple University, Philadelphia, PA and the National Institute of Justice, Washington, DC. August 2009.